
 HOME
HOME 市場調査レポート
次世代メモリ(記憶装置)の世界市場:2020年市場予測
Next Generation Memory Market by Technology (Nonvolatile memory (MRAM, FRAM, PCM, and RRAM), Volatile Memory (DRAM (T-RAM, T-T-RAM, and others) and SRAM (Z-RAM and others)), Application & Geography - Global Forecast to 2013 - 2020
- 出版元:MarketsandMarkets(米国)
- 発行年:2015年1月
- 定価 Single User License(1名様ライセンス)US$5,650(米国ドル)/Multi User License(5名様)$6,650 /Corporate User License $8,150
- ご請求は円換算(お見積り日TTSレート)となります。
- 納品形態:PDF by Email
- 当調査レポートは英文になります。
- 商品コード:MAM030
お問い合わせ、お見積りのリクエストは下のボタンをクリックしてご入力ください。


※当レポートには更新版(2023年予測)が発行されております。更新版は下記リンクよりご参照ください。
次世代メモリ(記憶装置)の世界市場:技術別、用途別2023年予測
【レポート紹介】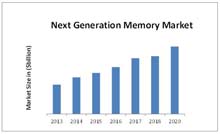
次世代メモリ(記憶装置)の世界市場は2014年以降、年平均成長率で38.28%の成長を続け、2020年に370億ドルに達すると予測されます。マルチコアコンピューティング、仮想化、プロセッサ統合などの背景トレンドを受けてエレクトロニクス、半導体業界では6400Mbps以上のデータレートを有し、既存型メモリよりも低い電力消費レベルの次世代メインメモリの必要性に迫られています。各種の新技術は現在商業化にむけて多様な段階にありますが、新メモリはフラッシュなど在来型メモリの多くを置き換えることになると期待されます。次世代の不揮発性メモリとしては、メモリスタまたは抵抗ランダムアクセスメモリ(ReRAM)、相変化メモリ(PCM)、磁気抵抗メモリ(MRAM)、及び強誘電体メモリ(FeRAM)、などがあります。
揮発性の次世代メモリ技術には、スタティックRAM (SRAM)、シンクロナスDRAM(SDRAM)、モバイルDRAM、などの新興DRAM技術があります。これらの中では現在MRAMとFeRAMだけが商業化されており、見るべき市場シェアを獲得しています。半導体メモリ業界は今後6~8年間は、これらの次世代型メモリの進化とともに、性能向上と消費電力低減という大きな相反課題への対応も迫られることになりそうです。
当レポートでは、次世代メモリの世界市場を詳細に調査分析、各種セグメントでの2019年に至る市場規模予測、動向分析、主要企業情報などを概略以下の構成でお届けいたします。
<セグメント別市場予測-2020年>
●技術別市場予測-2020年
(※用途別にデータ掲載)
・不揮発性メモリ
- ReRAM
- PCM
- MRAM
- FeRAM
- Others
・揮発性メモリ
- SRAM
- DRAM SRAM and DRAM (SDRAM, mobile DRAM, and other DRAM technologies)
●用途別市場予測-2020年
・コンシューマーエレクトロニクス
・大容量ストレージ(SSDs and hard disks, among others),
・携帯電話
・産業、自動車
・航空宇宙、防衛
・その他(smart cards and embedded MCUs)
●地域別市場予測-2020年
・南北アメリカ
・欧州
・アジア太平洋
・その他地域(ROW)
(※セグメント相互のクロスデータの掲載もあります。詳細は目次のデータ項目一覧 List of Tablesを参照ください)
<主要企業情報>
・Toshiba Corporation
・Intel Corporation
・Micron Technology, Inc.
・Sandisk Corporation
・Adesto Technologies
・Fujitsu Ltd
・SK Hynix, Inc.
・Samsung Electronics Co., Ltd.
・Cypress Semiconductor Corporation
・IBM Corporation
【レポート詳細目次、データ項目一覧(List of Tables)は当ページ下を参照ください】
英文詳細目次(table of contents)
【原文詳細目次】
Next Generation Memory Market by Technology (Nonvolatile memory (MRAM, FRAM, PCM, and RRAM), Volatile Memory (DRAM (T-RAM, T-T-RAM, and others) and SRAM (Z-RAM and others)), Application & Geography - Global Forecast to 2013 - 2020
Table of Contents
1 Introduction (Page No. - 15)
1.1 Objectives of the Study
1.2 Market Definition
1.3 Study Scope
1.3.1 Markets Covered
1.3.2 Geographic Scope
1.3.3 Years Considered for the Study
1.4 Currency
1.5 Package Size
1.6 Limitations
1.7 Stakeholders
2 Research Methodology (Page No. - 20)
2.1 Research Data
2.1.1 Secondary Data
2.1.1.1 Key Data From Secondary Sources
2.1.2 Primary Data
2.1.2.1 Key Data From Primary Sources
2.1.2.2 Key Industry Insights
2.1.2.3 Breakdown of Primaries
2.2 Factor Analysis
2.2.1 Introduction
2.2.2 Demand-Side Analysis
2.2.2.1 Growing Traditional Semiconductor Memory Market
2.2.2.2 Increasing Demand of High-Capacity Memory Solutions in the Consumer Electronics Sector
2.2.2.3 Wearable Electronics Market to Grow at A Steady Rate
2.2.3 Supply-Side Analysis
2.2.3.1 Number of New Product Launches: the Next-Generation Semiconductor Memory Solutions Market
2.2.3.2 Disruption in Memory Production in the APAC Region
2.3 Market Size Estimation
2.3.1 Bottom-Up Approach
2.3.2 Top-Down Approach
2.4 Market Breakdown & Data Triangulation
2.5 Research Assumptions and Limitations
2.5.1 Assumptions
2.5.2 Limitations
3 Executive Summary (Page No. - 34)
4 Premium Insights (Page No. - 40)
4.1 Increasing Research and Development Activities Are Expected to Offer New Application Market for Next-Generation Semiconductor Memory Solution
4.2 Next-Generation Semiconductor Memory Solution Market Growth, By Application
4.3 APAC: the Leader in the Next-Generation Semiconductor Memory Solution Market, By Application (2013)
4.4 China: Highest Growing Market for the Next-Generation Semiconductor Memory Solution Market in APAC
4.5 the Next-Generation Semiconductor Nonvolatile Memory Solution Market, By Application (2013)
4.6 the Next-Generation Semiconductor Memory Solution Market: Comparison Among Growth Rates of Top Countries in Various Regions in 2013 and 2020
4.7 the Next-Generation Semiconductor Memory Solution Market Size for Application, By Type of Memory
5 Market Overview (Page No. - 47)
5.1 Introduction
5.2 Market Segmentation
5.3 Market Evolution
5.4 Market Dynamics
5.4.1 Drivers
5.4.1.1 Need for High Speed, Low Power Consumption, and Highly Scalable Memory Device
5.4.1.2 Demand for Universal Memory Devices
5.4.1.3 Growing Demand for Mass Storage
5.4.2 Restraints
5.4.2.1 Stability in Extreme Environmental Conditions
5.4.2.2 Low Write Endurance Rate
5.4.2.3 Issues With Storage Densities and High Costs
5.4.3 Opportunities
5.4.3.1 Emerging Application Sectors
5.4.3.1.1 Industrial Applications
5.4.3.1.2 Flexible Electronics
5.4.3.1.3 Neural Network
5.4.3.2 Replacement to the Flash Memory
5.4.3.3 Flexible and Wearable Electronics Sector
5.4.4 Challenges
5.4.4.1 Manufacturing Challenges
5.5 Burning Issues
5.5.1 High Design Costs
5.5.2 Density Consideration
5.6 Winning Imperatives
5.6.1 Early Adoption of the Universal Memory Technologies
5.6.2 Strategy of Geographic Expansion in the Emerging Markets
6 Industry Trends (Page No. - 62)
6.1 Introduction
6.2 Value Chain Analysis
6.2.1 Value Chain Analysis: Next-Generation Semiconductor Memory Solution Market
6.3 Industry Trends
6.4 Porter’s Five Forces Analysis
6.4.1 Threats From New Entrants
6.4.2 Threats From Substitutes
6.4.3 Bargaining Power of Suppliers
6.4.4 Bargaining Power of Buyers
6.4.5 Intensity of Rivary
7 Next-Generation Semiconductor Memory Market, By Technology (Page No. - 71)
7.1 Introduction
7.2 Nonvolatile Next-Generation Memory Technologies
7.2.1 Memristor Or Resistive Random Access Memory (RCRAM)
7.2.2 Phase-Change Random-Access Memory (PCRAM)
7.2.3 Magnetoresistive Random-Access Memory (MRAM)
7.2.4 Ferroelectric Ram (FRAM)
7.2.5 Others
7.3 Volatile Next-Generation Memory Technologies
7.3.1 Dynamic Random Access Memory (DRAM)
7.3.1.1 T-Ram
7.3.1.2 T-Tram
7.3.1.3 Other Emerging DRAM Technologies
7.3.2 Static Random-Access Memory (SRAM)
7.3.2.1 Z-Ram
8 Market Analysis, By Application (Page No. - 98)
9 Next-Generation Memory Market, By Application (Page No. - 99)
9.1 Introduction
9.1.1 Consumer Electronics
9.1.2 Mass Storage
9.1.3 Mobile Phones
9.1.4 Industrial and Automotive
9.1.5 Aerospace and Defense
9.1.6 Others
10 Geographic Analysis (Page No. - 141)
10.1 Introduction
10.2 North America
10.2.1 U.S.
10.2.2 Canada
10.2.3 Mexico
10.3 Europe
10.3.1 Germany
10.3.2 U.K.
10.3.3 France
10.3.4 Italy
10.3.5 Others
10.4 Asia-Pacific
10.4.1 China
10.4.2 Japan
10.4.3 Taiwan
10.4.4 South Korea
10.4.5 Others
10.5 Rest of the World
11 Competitive Landscape (Page No. - 169)
11.1 Overview
11.2 Market Share Analysis of the Next-Generation Memory Market
11.3 Competitive Situation and Trends
11.3.1 New Product Launches
11.3.2 Collaborations, Partnerships, and Agreements
12 Company Profiles (Page No. - 177)
12.1 Introduction
12.2 Toshiba Corporation
12.2.1 Business Overview
12.2.2 Product Portfolio
12.2.3 Key Strategies
12.2.4 Recent Developments
12.2.5 SWOT Analysis
12.2.6 MNM View
12.3 Intel Corporation
12.3.1 Business Overview
12.3.2 Products & Services
12.3.3 Key Strategies
12.3.4 Recent Developments
12.3.5 SWOT Analysis
12.3.6 MNM View
12.4 Micron Technology, Inc.
12.4.1 Business Overview
12.4.2 Product Portfolio
12.4.3 Key Strategies
12.4.4 Recent Developments
12.4.5 SWOT Analysis
12.4.6 MNM View
12.5 Sandisk Corporation
12.5.1 Business Overview
12.5.2 Product Portfolio
12.5.3 Key Strategies
12.5.4 Recent Developments
12.5.5 SWOT Analysis
12.5.6 MNM View
12.6 Adesto Technologies
12.6.1 Business Overview
12.6.2 Product Portfolio
12.6.3 Key Strategy
12.6.4 Recent Developments
12.7 Fujitsu Ltd
12.7.1 Business Overview
12.7.2 Products, Services, and Solutions Offerings
12.7.3 Key Strategy
12.7.4 Recent Developments
12.8 SK Hynix, Inc.
12.8.1 Business Overview
12.8.2 Products and Solutions Offerings
12.8.3 Key Strategy
12.8.4 Recent Developments
12.8.5 SWOT Analysis
12.8.6 MNM View
12.9 Samsung Electronics Co., Ltd.
12.9.1 Business Overview
12.9.2 Product Offerings
12.9.3 Key Strategy
12.9.4 Recent Developments
12.9.5 SWOT Analysis
12.9.6 MNM View
12.10 Cypress Semiconductor Corporation
12.10.1 Business Overview
12.10.2 Product Offerings
12.10.3 Key Strategy
12.10.4 Recent Developments
12.11 IBM Corporation
12.11.1 Business Overview
12.11.2 Product Offerings
12.11.3 Key Strategy
12.11.4 Recent Developments
13 Appendix (Page No. - 218)
13.1 Insights of Industry Experts
13.2 Discussion Guide
13.3 Introducing RT: Real-Time Market Intelligence
13.4 Available Customizations
13.5 Related Reports
List of Tables (86 Tables)
Table 1 the Need for Technologically Advanced Processing Techniques Drive the Market Growth
Table 2 Write Endurance of Different Memory Technologies
Table 3 Impact Analysis of Restraints
Table 4 Impact Analysis of Opportunities
Table 5 Impact Analysis of Challenges
Table 6 Nonvolatile Memory vs. Volatile Memory
Table 7 Global Next-Generation Semiconductor Memory Solution Market Size, By Technology, 2013–2020 ($ Million)
Table 8 Global Next-Generation Semiconductor Nonvolatile Memory Solution Market Size, By Technology, 2013–2020 ($ Million)
Table 9 Next-Generation Semiconductor Nonvolatile Memory Solution Market Size, By Application, 2013–2020 ($ Million)
Table 10 Next-Generation Semiconductor RCRAM Memory Market Size, By Application, 2013–2020 ($ Million)
Table 11 PROS and CONS of Phase-Change Memory (PCRAM)
Table 12 Next-Generation Semiconductor PCRAM Memory Market Size, By Application, 2013–2020 ($ Million)
Table 13 Next-Generation Semiconductor MRAM Memory Market Size, By Application, 2013–2020 ($ Million)
Table 14 PROS and CONS of the Feram Memory Technology
Table 15 Comparison Between FRAM and Flash Memory
Table 16 Next-Generation Semiconductor FRAM Memory Market Size, By Application, 2013–2020 ($ Million)
Table 17 Next-Generation Semiconductor Other Nonvolatile Memory Solution Market Size, By Application, 2013–2020 ($ Million)
Table 18 Global Next-Generation Semiconductor Volatile Memory Market Size, By Technology, 2013–2020 ($ Million)
Table 19 Next-Generation Semiconductor Volatile Memory Market Size, By Application, 2013–2020 ($Million)
Table 20 Next-Generation Semiconductor DRAM Memory Market Size, By Application, 2013–2020 ($ Million)
Table 21 Next-Generation Semiconductor SRAM Memory Market Size, By Application, 2013–2020 ($ Million)
Table 22 Next-Generation Memory Market Size, By Application, 2013–2020 ($ Million)
Table 23 Next-Generation Memory Market Size for the Consumer Electronics Segment, By Technology Type, 2013–2020, ($ Million)
Table 24 Next-Generation Memory Market Size for the Consumer Electronics Segment, By Nonvolatile Technology, 2013–2020 ($ Million)
Table 25 Next-Generation Memory Market Size for the Consumer Electronics Segment, By Region, 2013–2020 ($ Million)
Table 26 North America: Market Size for the Consumer Electronics Segment, By Country, 2013–2020 ($ Million)
Table 27 Europe: Next-Generation Memory Market Size for the Consumer Electronics Segment, By Country, 2013–2020 ($ Million)
Table 28 APAC: Next-Generation Memory Market Size for the Consumer Electronics Segment, By Country, 2013–2020 ($ Million)
Table 29 ROW: Next-Generation Memory Market Size for the Consumer Electronics Segment, By Region, 2013–2020 ($ Million)
Table 30 Next Generation Memory Market Size for the Mass Storage Segment, By Technology Type, 2013–2020, ($ Million)
Table 31 Next-Generation Memory Market Size for the Mass Storage Segment, By Nonvolatile Technology, 2013–2020 ($ Million)
Table 32 Next-Generation Memory Market Size for the Mass Storage Segment, By Region, 2013–2020 ($ Million)
Table 33 North America: Next-Generation Memory Market Size for the Mass Storage Segment, By Country, 2013–2020 ($ Million)
Table 34 Europe: Next-Generation Memory Market Size for the Mass Storage Application Segment, By Country, 2013–2020 ($ Million)
Table 35 APAC: Next-Generation Memory Market Size for the Mass Storage Segment, By Country, 2013–2020 ($ Million)
Table 36 ROW: Market Size for the Mass Storage Application Segment, By Region, 2013–2020 ($ Million)
Table 37 Next-Generation Memory Market Size for the Mobile Phones Segment, By Technology , 2013–2020, ($ Million)
Table 38 Market Size for the Mobile Phones Segment, By Nonvolatile Technology, 2013–2020 ($ Million)
Table 39 Next-Generation Memory Market Size for the Mobile Phones Segment, By Region, 2013–2020 ($ Million)
Table 40 North America: Market Size for the Mobile Phones Segment, By Country, 2013–2020 ($ Million)
Table 41 Europe: Market Size for the Mobile Phones Application Segment, By Country, 2013–2020 ($ Million)
Table 42 APAC: Market Size for the Mobile Phones Segment, By Country, 2013–2020 ($ Million)
Table 43 ROW: Market Size for the Mobile Phones Application Segment, By Region, 2013–2020 ($ Million)
Table 44 Next-Generation Memory Market Size for the Industrial and Automotive Segment, By Technology , 2013–2020, ($ Million)
Table 45 Market Size for the Industrial and Automotive Segment, By Nonvolatile Technology, 2013–2020 ($ Million)
Table 46 Market Size for the Industrial and Automotive Segment, By Region, 2013–2020 ($ Million)
Table 47 North America: Market Size for the Industrial and Automotive Segment, By Country, 2013–2020 ($ Million)
Table 48 Europe: Market Size for the Industrial and Automotive Segment, By Country, 2013–2020 ($ Million)
Table 49 APAC: Market Size for the Industrial and Automotive Segment, By Country, 2013–2020 ($ Million)
Table 50 ROW: Market Size for the Industrial and Automotive Segment, By Region, 2013–2020 ($ Million)
Table 51 Next-Generation Memory Market Size for the Aerospace and Defense Application Segment, By Technology Types, 2013–2020, ($ Million)
Table 52 Next-Generation Memory Market Size for the Aerospace and Defense Application Segment, By Nonvolatile Technology, 2013–2020 ($ Million)
Table 53 Next-Generation Memory Market Size for the Aerospace and Defense Segment, By Region, 2013–2020 ($ Million)
Table 54 North America: Market Size for the Aerospace and Defense Segment, By Country, 2013–2020 ($ Million)
Table 55 Europe: Market Size for the Aerospace and Defense Segment, By Country, 2013–2020 ($ Million)
Table 56 APAC: Market Size for the Aerospace and Defense Segment, By Country, 2013–2020 ($ Million)
Table 57 ROW: Market Size for the Aerospace and Defense Segment, By Region, 2013–2020 ($ Million)
Table 58 Next-Generation Memory Market Size for the Others Segment, By Technology , 2013–2020, ($ Million)
Table 59 Next-Generation Memory Market Size for the Others Segment, By Nonvolatile Technology, 2013–2020 ($ Million)
Table 60 Next-Generation Memory Market Size for the Others Segment, By Region, 2013–2020 ($ Million)
Table 61 North America: Market Size for the Others Segment, By Country, 2013–2020 ($ Million)
Table 62 Europe: Market Size in Others Segment, By Country, 2013–2020 ($ Million)
Table 63 APAC: Market Size for the Others Segment, By Country, 2013–2020 ($ Million)
Table 64 Next-Generation Memory Market Size, By Region, 2013 – 2020 ($Million)
Table 65 North America: Market Size, By Application, 2013 – 2020 ($Million)
Table 66 North America: Market Size, By Country, 2013 – 2020 ($Million)
Table 67 U.S. Market Size, By Application, 2013-2020 ($Million)
Table 68 Canada: Next-Generation Memory Market Size, By Application, 2013-2020 ($Million)
Table 69 Mexico: Market Size, By Application, 2013-2020 ($Million)
Table 70 Europe: Market Size, By Application, 2013 – 2020 ($Million)
Table 71 European Market Size, By Country, 2013-2020 ($Million)
Table 72 Germany: Market Size, By Application, 2013-2020 ($Million)
Table 73 U.K. Market Size, By Application, 2013-2020 ($Million)
Table 74 France: Market Size, By Application, 2013-2020 ($Million)
Table 75 Italy: Market Size, By Application, 2013-2020 ($Million)
Table 76 Others: Market Size, By Application, 2013-2020 ($Million)
Table 77 APAC: Market Size, By Application, 2013 – 2020 ($Million)
Table 78 APAC Next-Generation Memory Market Size, By Country, 2013-2020 ($Million)
Table 79 China: Market Size, By Application, 2013-2020 ($Million)
Table 80 Japan: Market Size, By Application, 2013-2020 ($Million)
Table 81 Taiwan: Market Size, By Application, 2013-2020 ($Million)
Table 82 South Korea: Market Size, By Application, 2013-2020 ($Million)
Table 83 Others: Market Size, By Application, 2013-2020 ($Million)
Table 84 Rest of World: Market Size, By Region, 2013-2020 ($Million)
Table 85 New Product Launches, 2011–2014
Table 86 Collaborations, Partnerships, and Agreements, 2011–2014
List of Figures (71 Figures)
Figure 1 Next-Generation Memory Markets Covered
Figure 2 Research Design
Figure 3 Overall Traditional Semiconductor Memory Market Analysis
Figure 4 Increasing Consumer Electronics Market
Figure 5 Number of New Product Launches: Next-Generation Semiconductor Memory Solution Market ( 2011–2014)
Figure 6 Bottom-Up Approach
Figure 7 Top-Down Approach
Figure 8 Assumptions of the Research Study
Figure 9 Limitations of the Research Study
Figure 10 Roadmap for the Memory Technology
Figure 11 Next-Generation Semiconductor Memory Solution Market Snapshot, By Application (2013 vs. 2020)
Figure 12 Global Next-Generation Semiconductor Memory Solution Market, By Region, 2013
Figure 13 Global Next-Generation Semiconductor Memory Solution Market Share, By Key Player, 2013
Figure 14 New Product Development Was One of the Key Strategies Adopted By Top Companies
Figure 15 Mass Storage Segments Are Likely to Contribute to the Demand of the Next-Generation Memory Solution Market
Figure 16 The Mass Storage Application Dominated the Overall Next-Generation Semiconductor Memory Solution Market (2013)
Figure 17 Mass Storage Captures the Largest Share in the APAC Market
Figure 18 APAC: to Offer Attractive Opportunities for Next-Generation Semiconductor Memory Solutions
Figure 19 PCRAM is the Most Preferred Nonvolatile Memory for the Mobile Phones Applications
Figure 20 APAC Has A Larger Growth Rate as Compared to North America, Europe, and ROW
Figure 21 Nonvolatile Memory Finds the Largest Application in Mass Storage Applications
Figure 22 Next Generation Memory Market Segmentation
Figure 23 Evolution of Different Next Generation Memory Technologies
Figure 24 Need for High Speed, Low Power Consumption, and Highly Scalable Memory Devices
Figure 25 Flash Memory Market
Figure 29 Nonvolatile Memory Accounted for the Major Share of the Next-Generation Semiconductor Memory Solution Market, 2013
Figure 30 Mobile Phones Application Has the Highest Growth Potential for Nonvolatile Next-Generation Memory Solution Market
Figure 31 RCRAM Has High Growth Potential in Consumer Electronics Application
Figure 32 PCRAM Technolo0gy Holds the Largest Market Share in Mobile Phones Applications
Figure 33 MRAM Technolo0gy is Being Dominated By Mass Storage Applications
Figure 34 FRAM Technolo0gy Finds Maximum Applications in the Industrial and Automotive Sector
Figure 35 DRAM Technol0gy Market is Expected to Have the Larger Market Share Compared to SRAM in the Next-Generation Volatile Memory Technology
Figure 36 Consumer Electronics Application Has High Growth Potential in Volatile Next-Generation Semiconductor Memory Solutions
Figure 37 Mobile Phone Application Has High Growth Potential in SRAM Memory Solutions
Figure 38 Next-Generation Memory Market, By Application
Figure 39 Mass Storage Application is Expected to Retain the Largest Market Share in the Market
Figure 40 In North America, U.S. is Expected to Retain the Largest Market Share in the Next-Generation Memory Market for the Consumer Application
Figure 41 In the Mass Storage Application Segment of the Market, Nonvolatile Memory Technologies Are Expected to Retain the Largest Market Share
Figure 42 In the APAC Region, China is Expected to Retain the Largest Market Share in the Next-Generation Memory Market for the Mass Storage Application Segment
Figure 43 The APAC Region is Expected to Retain the Largest Market Share in the Global Next-Generation Memory Market for the Mobile Application Segment
Figure 44 In Industrial and Automotive Application Segment of the Market, Nonvolatile Memory Technologies Are Expected to Retain the Largest Market Share
Figure 45 In APAC , China is Expected to Retain the Largest Market Share in the Next-Generation Memory Market for the Industrial and Automotive Application
Figure 46 APAC is Expected to Retain the Largest Market Share in the Global Next-Generation Memory Market for the Aerospace and Defense Application
Figure 47 in Other Applications Segment of the Market, Nonvolatile Memory Technologies Are Expected to Retain the Largest Market Share
Figure 48 Geographic Snapshot (2013)
Figure 49 Geographic Benchmarking of Different Applications (2014-2020)
Figure 50 The North American Market Snapshot: Demand Would Be Driven By Mobile Phones and Consumer Electronics
Figure 51 The Asia-Pacific Next-Generation Memory Market Snapshot – China is the Most Lucrative Market
Figure 52 Companies Adopted New Product Launch as the Key Growth Strategy Over the Last Four Years
Figure 53 Micron Technology, Inc. Grew at the Fastest Rate Between 2010 and 2013
Figure 54 Global Net Generation Memory Market Share, By Key Player, 2013
Figure 55 Next-Generation Memory Market Evolution Framework: New Product Developments Have Fueled Growth and Innovation During 2011–2014
Figure 56 Battle for Market Share: New Product Launches Was the Key Strategy
Figure 57 Geographic Revenue Mix of Top Five Market Players
Figure 58 Competitive Benchmarking of Key Market Players (2007–2013): Samsung Electronics Co., Ltd Emerged as A Champion With the Highest Growth Rate
Figure 59 Toshiba Corporation: Company Snapshot
Figure 60 Intel Corporation: Company Snapshot
Figure 61 Intel Corporation: SWOT Analysis
Figure 62 Micron Technology, Inc.: Company Snapshot
Figure 63 Sandisk Corporation: Company Snapshot
Figure 64 Adesto Technologies: Company Snapshot
Figure 65 Fujitsu Ltd: Business Overview
Figure 66 SK Hynix, Inc.: Business Overview
Figure 67 SK Hynix, Inc.: SWOT Analysis
Figure 68 Samsung Electronics Co., Ltd: Business Overview
Figure 69 Samsung Electronics Co., Ltd: SWOT Analysis
Figure 70 Cypress Semiconductor Corporation: Business Overview
Figure 71 IBM Corporation: Business Overview
プレスリリース
プレスリリース
 当レポートのプレスリリースは発行されておりません。
 リサーチカテゴリ一覧
 スマートグリッド
 お問合わせはこちらから