
 HOME
HOME 市場調査レポート
ホログラフィック・ディスプレイ(Holographic Display)の世界市場:2020年市場予測
Holographic Display Market by Technology (Electro holographic, Touchable, Laser), Product (Camera, Digital Signage, Medical scanners, Smart TV), Application (Consumer, Commercial, Medical, Industrial ), Geography - Global Forecast to 2013 - 2020
- 出版元:MarketsandMarkets(米国)
- 発行年:2015年1月
- 定価 Single User License(1名様ライセンス)US$5,650(米国ドル)/Multi User License(5名様)$6,650 /Corporate User License $8,150
- ご請求は円換算(お見積り日TTSレート)となります。
- 納品形態:PDF by Email
- 当調査レポートは英文になります。
- 商品コード:MAM035
お問い合わせ、お見積りのリクエストは下のボタンをクリックしてご入力ください。


【レポート紹介】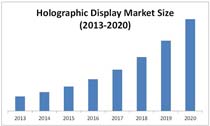
ホログラフィック・ディスプレイの世界市場は、2014年から年平均成長率30.23%の成長を続け2020年に35億7000万ドル規模に達すると予測されます。成長は全体として堅調で、バリューチェーンのベンダー企業にとっては多くの市場機会が存在していると言えるでしょう。同市場は未だ完全商業化への導入段階にありますが、今後医療画像、スマートフォンなどのスマートデバイス、コンシューマーエレクトロニクスへの採用増加が見込まれます。また最近では製品発表、カンファレンス、ショーなどの各種イベントでホログラフィックディスプレイ(プロジェクター)が使用される事例もあり、こうしたことも認知度向上や市場の促進要因となるでしょう。
当レポートでは、ホログラフィック・ディスプレイの世界市場を詳細に調査分析、各種セグメントでの2020年に至る市場規模予測、動向分析、主要企業情報などを概略以下の構成でお届けいたします。
<セグメント別市場予測-2020年>
●技術セグメント別市場予測~2020年
・semi-transparent/electro holographic
・touchable
・laser/plasma
・pistons
●製品タイプ別予測~2020年
・Cameras
・digital signage
・kiosks
・medical scanner
・notebooks(Laptop)
・smart TV (Holo TV)
・Others (smartphones, smart watches, wearable devices, and smart glasses)
●用途別予測~2020年
・consumer
・commercial
・medical
・defense
・industrial
・Other
●国、地域別市場予測~2020年
・北米
- 米国
- カナダ
- メキシコ
・欧州
- ドイツ
- 英国
- フランス
- スペイン
- その他欧州
・アジア太平洋
- 日本
- 中国
- インド
- 韓国
- その他アジア太平洋
・その他地域(rest of the world)
- 中東アフリカ
- イスラエル
(※セグメント相互のクロスデータも掲載されています。詳細は目次のList of Tablesを参照ください)
<主要企業情報>
・AV Concepts
・EON Reality
・Konica Minolta, Inc.
・Qualcomm Incorporated
・Zebra Imaging
・Holoxica Limited
・Musion Das Hologram Ltd.
・Provision Holding, Inc.
・Realview Imaging Ltd
・Viewsonic Corporation
【レポート詳細目次、データ項目一覧(List of Tables)は当ページ下を参照ください】
英文詳細目次(table of contents)
【原文詳細目次】
Holographic Display Market by Technology (Electro holographic, Touchable, Laser), Product (Camera, Digital Signage, Medical scanners, Smart TV), Application (Consumer, Commercial, Medical, Industrial ), Geography - Global Forecast to 2013 - 2020
Table of Contents
1 Introduction (Page No. - 15)
1.1 Objectives of the Study
1.2 Market Definition
1.3 Study Scope
1.3.1 Markets Covered
1.3.2 Geographic Scope
1.3.3 Years Considered for the Study
1.4 Currency
1.5 Package Size
1.6 Limitations
1.7 Stakeholders
2 Research Methodology (Page No. - 20)
2.1 Holographic Displays Demand Model
2.2 Market Size Estimation
2.3 Demand Side Analysis
2.3.1 Introduction
2.3.2 Demand Side Analysis
2.4 Market Crackdown and Data Trangulation
2.5 Market Share Estimation
2.5.1 Key Points Taken From Secondary Sources
2.5.2 Key Data Taken From Primary Sources
2.5.2.1 Key Industry Insights
2.6 Assumptions
3 Executive Summary (Page No. - 30)
4 Premium Insights (Page No. - 35)
4.1 Attractive Market Opportunities for the Holographic Display
4.2 Market – Top Three Product Segments
4.3 Holographic Display Market in the Asia-Pacific Region
4.4 Asia-Pacific is Expected to Emerge as the Fastest Growing Market at A CAGR of 31.26%
4.5 Market: Application (2020)
4.6 Market: Developed vs. Developing Nations
4.7 Global Holographic Display Market: Industrial and Commercial Sectors (2020)
4.8 Life Cycle Analysis of the Market, By Geography
5 Market Overview (Page No. - 42)
5.1 Introduction
5.2 Market Definition
5.3 Evolution
5.4 Market Segmentation
5.4.1 Market By Technology
5.4.2 Market By Product Type
5.4.3 Market By Application
5.4.4 Market By Geography
5.5 Market Dynamics
5.5.1 Drivers
5.5.1.1 Adoption of Holographic Displays in Multiple Industries
5.5.1.2 Increased Demand of Holographic Displays in Events and Advertisements
5.5.1.3 Holography for Medical Imaging in Healthcare Industry
5.5.2 Restraints
5.5.2.1 Less Effective Projection Under Sunlight
5.5.2.2 Cost Affecting the Growth of Holographic Displays
5.5.3 Opportunities
5.5.3.1 Advancements in Holographic Displays
5.5.3.2 Rapidly Advancing Smartphone and Tablet Market
5.5.4 Challenge
5.5.4.1 Technological Concerns
6 Industry Analysis (Page No. - 55)
6.1 Introduction
6.2 Value Chain Analysis
6.3 Supply Chain Analysis
6.3.1 Key Influencers
6.4 Industry Trends
6.5 Porter’s Five Forces Model
6.5.1 Threat of New Entrants
6.5.2 Threat 0f Substitutes
6.5.3 Bargaining Power of Buyers
6.5.4 Bargaining Power of Suppliers
6.5.5 Intensity of Rivalry
6.6 Strategic Benchmarking
6.6.1 Technology Integration & Product Enhancement
7 Holographic Display Market, By Technology (Page No. - 69)
7.1 Introduction
7.1.1 SEMI Transparent/Electro Holographic Display
7.1.2 Touchable
7.1.3 Laser
7.1.4 Pistons
8 Market By Product Type (Page No. - 77)
8.1 Introduction
8.2 Camera
8.3 Digital Signage
8.4 Kiosks
8.5 Medical Imaging/Scanners
8.5.1 Computed Tomography (CT) and Magnetic Resonance Imaging (MRI)
8.5.2 Ultrasound
8.6 Notebook and Laptop
8.7 Smart TV’s/Holo TV’s
8.8 Others
8.8.1 Smart Watch
8.8.2 Smart Glass
8.8.3 Smartphones
9 Market By Application (Page No. - 89)
9.1 Introduction
9.2 Consumer Applications
9.3 Commercial Applications
9.4 Medical and Healthcare
9.5 Defense
9.6 Industrial Applications
9.7 Other Applications
9.7.1 Education
9.7.2 Automotive
10 Geographical Analysis (Page No. - 101)
10.1 Introduction
10.2 North America
10.2.1 U.S.
10.2.2 Canada
10.2.3 Mexico
10.3 Europe
10.3.1 Germany
10.3.2 U.K.
10.3.3 France
10.3.4 Spain
10.3.5 Rest of Europe
10.4 APAC
10.4.1 China
10.4.2 Japan
10.4.3 India
10.4.4 South Korea
10.4.5 Rest of Asia Pacific
10.5 Rest of the World (ROW)
10.5.1 Middle East & Africa
10.5.2 Israel
11 Competitive Landscape (Page No. - 141)
11.1 Overview
11.2 Competitive Situation and Trends
11.2.1 New Product Launches
11.2.2 Agreements, Partnerships, Collaborations, and Joint Ventures
11.2.3 Mergers and Acquisitions
11.2.4 Othere Developments
12 Company Profiles (Page No. - 148)
12.1 Introduction
12.2 AV Concepts
12.2.1 Business Overview
12.2.2 Products and Srevices
12.2.3 Key Strategy
12.2.4 Recent Developments
12.3 EON Reality
12.3.1 Business Overview
12.3.2 Products and Services
12.3.3 Key Strategy
12.3.4 Recent Developments
12.3.5 MNM View
Konica Minolta, Inc.
12.3.6 Business Overview
12.3.7 Products Offered
12.3.8 Key Strategy
12.3.9 Recent Developments
12.3.10 MNM View
12.4 Qualcomm Incorporated
12.4.1 Business Overview
12.4.2 Products and Services
12.4.3 Key Strategy
12.4.4 Recent Developments
12.4.5 MNM View
12.5 Zebra Imaging
12.5.1 Business Overview
12.5.2 Products Offered
12.5.3 Key Strategy
12.5.4 Recent Developments
12.5.5 MNM View
12.6 Holoxica Limited
12.6.1 Business Overview
12.6.2 Products and Services
12.6.3 Key Strategy
12.6.4 Recent Developments
12.7 Musion Das Hologram Ltd.
12.7.1 Business Overview
12.7.2 Products Offered
12.7.3 Key Strategy
12.7.4 Recent Developments
12.8 Provision Holding, Inc.
12.8.1 Business Overview
12.8.2 Products Offered
12.8.3 Key Strategy
12.8.4 Recent Developments
12.9 Realview Imaging Ltd.
12.9.1 Business Overview
12.9.2 Products Offered
12.9.3 Key Strategy
12.9.4 Recent Developments
12.1 Viewsonic Corporation
12.10.1 Business Overview
12.10.2 Products Offered
12.10.3 Key Strategy
12.10.4 Recent Developments
12.10.5 MNM View
13 Appendix (Page No. - 178)
List of Tables (81 Tables)
Table 1 The Medical Imaging Will Swell the Growth of Holographic Display Market
Table 2 Cost Effectiveness Will Obstruct the Growth of Holographic Display Market
Table 3 The Advancement in the Holographic Display Technology Will Increase the Demand in Future
Table 4 Some of the Prominent Companies in the Holographic Display Market
Table 5 Global Market Size, By Technology, 2013-2020 ($Million)
Table 6 Global SEMI – Transparent Market Size, By Product Type, 2013-2020, ($Million)
Table 7 Global Touchable Market Size By Product Type, 2013-2020 ($Million)
Table 8 Global Laser/Plasma Market Size By Product Type, 2013-2020 ($Million)
Table 9 Global Piston Holographic Display Market Size By Product Type, 2013-2020 ($Thousand)
Table 10 Camera: Market Size , By Technology, 2013 – 2020 ($Thousand)
Table 11 Camera: Market Size , By Application 2013 – 2020 ($Million)
Table 12 Digital Signage Holographic Display Market Size, By Technology, 2013 – 2020 ($Million)
Table 13 Digital Signage Market Size, By Application, 2013 – 2020 ($Million)
Table 14 Kiosk Holographic Display Market Size, By Technology, 2013 – 2020 ($Million)
Table 15 Kiosk Market Size, By Application, 2013 – 2020 ($Million)
Table 16 Medical Scanner Market Size, By Technology, 2013 – 2020 ($Million)
Table 17 Medical Scanner Market Size By Application, 2013 – 2020 ($Million)
Table 18 Notebook Holographic Display Market Size, By Technology, 2013 – 2020 ($Million)
Table 19 Notebook Market Size, By Application, 2013 – 2020 ($Million)
Table 20 Smart TV Market Size, By Technology, 2013 – 2020 ($Thousand)
Table 21 Smart TV Market Size, By Application, 2013 – 2020 ($Million)
Table 22 Other Product Holographic Display Market Size, By Technology, 2013 – 2020 ($Thousand)
Table 23 Other Product Market Size, By Application, 2013 – 2020 ($Million)
Table 24 Market Size for Consumer Application, By Product Type, 2013 – 2020 ($Million)
Table 25 Global Holographic Display Market Size for Consumer Application, By Geography, 2013 – 2020 ($Million)
Table 26 Market Size for Commercial Application, By Product Type, 2013 – 2020 ($Million)
Table 27 Global Market Size for Commercial Application, By Geography, 2013 – 2020 ($Million)
Table 28 Market Size for Medical Application, By Product Type, 2013 – 2020 ($Million)
Table 29 Global Market Size for Medical Application, By Geography, 2013 – 2020 ($Million)
Table 30 Market Size for Defense Application, By Product Type, 2013 – 2020 ($Million)
Table 31 Global Market Size for Defense Application, By Geography, 2013 – 2020 ($Million)
Table 32 Market Size for Industrial Application, By Product Type, 2013 – 2020 ($Million)
Table 33 Global Market Size for Industrial Application, By Geography, 2013 – 2020 ($Million)
Table 34 Market Size for Other Application, By Product Type, 2013 – 2020 ($Million)
Table 35 Global Market Size for Other Application, By Geography, 2013 – 2020 ($Million)
Table 36 North America Holographic Display Market Size, By Application, 2013 – 2020 ($Million)
Table 37 North America Market Size, By Country, 2013 – 2020 ($Million)
Table 38 North America Market Size for Consumer Application, By Country, 2013 – 2020 ($Million)
Table 39 North America Market Size for Commercial Application, By Geography, 2013 – 2020 ($Million)
Table 40 North America Market Size for Medical Application, By Country, 2013 – 2020 ($Million)
Table 41 North America Market Size for Defense Application, By country, 2013 – 2020 ($Million)
Table 42 North America Market Size for Industrial Application, By Country, 2013 – 2020 ($Million)
Table 43 U.S. Holographic Display Market Size, By Application, 2013 – 2020 ($Million)
Table 44 Canada Market Size, By Application, 2013 – 2020 ($Million)
Table 45 Mexico Market Size, By Application, 2013 – 2020 ($Thousand)
Table 46 Europe Holographic Display Market Size, By Application, 2013 – 2020 ($Million)
Table 47 Europe Market Size, By Country, 2013 – 2020 ($Million)
Table 48 Europe Market Size for Consumer Application, By Country, 2013 – 2020 ($Thousand)
Table 49 Europe Market Size for Commercial Application, By Country, 2013 – 2020 ($Thousand)
Table 50 Europe Market Size for Medical Application, By Country, 2013 – 2020 ($Thousand)
Table 51 Europe Market Size for Defense, By Country, 2013 – 2020 ($Thousand)
Table 52 Europe Market Size for Industrial Application, By Country, 2013 – 2020 ($Thousand)
Table 53 Germany Market Size, By Application, 2013 – 2020 ($Million)
Table 54 U.K. Holographic Display Market Size, By Application, 2013 – 2020 ($Million)
Table 55 France Market Size, By Application, 2013 – 2020 ($Thousand)
Table 56 Spain Market Size, By Application, 2013 – 2020 ($Thousand)
Table 57 Rest of Europe Market Size, By Application, 2013 – 2020 ($Thousand)
Table 58 APAC Holographic Display Market Size, By Application, 2013 – 2020 ($Million)
Table 59 APAC Market Size, By Country, 2013 – 2020 ($Million)
Table 60 APAC Market Size for Consumer Application, By Country, 2013 – 2020 ($Million)
Table 61 APAC Market Size for Commercial Application, By Country, 2013 – 2020 ($Million)
Table 62 APAC Market Size for Medical Application, By Country, 2013 – 2020 ($Million)
Table 63 APAC Market Size for Defense Application, By Country, 2013 – 2020 ($Million)
Table 64 APAC Market Size for Industrial Application, By Country, 2013 – 2020 ($Million)
Table 65 China Market Size, By Application, 2013 – 2020 ($Million)
Table 66 Japan Market Size, By Application, 2013 – 2020 ($Million)
Table 67 India Market Size, By Application, 2013 – 2020 ($Million)
Table 68 South Korea Market Size, By Application, 2013 – 2020 ($Million)
Table 69 Rest of Asia Pacific Market Size, By Application, 2013 – 2020 ($Million)
Table 70 ROW Holographic Display Market Size, By Application, 2013 – 2020 ($Million)
Table 71 ROW Market Size, By Country, 2013 – 2020 ($Million)
Table 72 ROW Market Size for Consumer Application, By Country, 2013 – 2020 ($Thousand)
Table 73 ROW Market Size for Commercial Application, By Country, 2013 – 2020 ($Thousand)
Table 74 ROW Market Size for Medical Application, By Country, 2013 – 2020 ($Thousand)
Table 75 ROW Market Size for Defense Application, By Country, 2013 – 2020 ($Thousand)
Table 76 ROW Market Size for Industrial Application, By Country, 2013 – 2020 ($Thousand)
Table 77 Middle East & Africa Market Size, By Application, 2013 – 2020 ($Million)
Table 78 Israel Holographic Display Market Size, By Application, 2013 – 2020 ($Million)
Table 79 New Product Launches, 2011 - 2014
Table 80 Agreements, Partnerships, Collaborations, and Joint Ventures, 2011-2014 145
Table 81 Mergers and Acquisitions, 2012-2014
List of Figures (57 Figures)
Figure 1 Markets Covered
Figure 2 Holographic Display Market: Research Methodology
Figure 3 Market Size Estimation Methodology: Bottom-Up Approach
Figure 4 Market Size Estimation Methodology: Top-Down Approach
Figure 5 Breakdown of Primary Interviews: By Company Type, Designation, and Region
Figure 6 Amongst All the Holographic Application Medical Applications Held Highest Market Share and CAGR
Figure 7 Holographic Displays, By Product Type: Snapshot
Figure 8 Market, By Geography: Snapshot
Figure 9 Attractive Market Opportunities in the Holographic Display
Figure 10 Medical Scanners to Grow at the Fastest Rate Among the Top Three Products in the Holographic Display Market
Figure 11 The Medical Captured the Maximum Share in the Emerging Asia-Pacific Market
Figure 12 In APAC, China and Japan Are Estimated to Emerge as the Fastest Growing Market
Figure 13 The Medical and Commercial Sectors Will Continue to Dominate the North American Market From 2014 to 2020
Figure 14 Developing Markets to Grow Faster Than the Developed Ones
Figure 15 The Industrial Segment Has A Promising Future in the Emerging Economies of the APAC Region
Figure 16 Evolution: Holographic Display Technology
Figure 17 Market Segmentation: By Technology
Figure 18 Market Segmentations: By Components
Figure 19 Market Segmentations: By Products
Figure 20 Market Segmentation: By Application
Figure 21 Market Segmentation: By Geography
Figure 22 Increased R&D and Healthcare Industry Will Increase the Demand for the Market
Figure 23 Value Chain Analysis (2013): Major Value Addition is Done During Manufacturing and Assembling Phases
Figure 24 Supply Chain of Major Players in the Market
Figure 25 Key Industry Trends in the Holographic Display Market
Figure 26 Porter’s Five Forces Analysis
Figure 27 The Porter’s Five Forces Analysis for the Market
Figure 28 Threat of New Entrants
Figure 29 Threat of Substitutes
Figure 30 Bargaining Power of Buyers
Figure 31 Bargaining Power of Suppliers
Figure 32 Intensity of Rivalry
Figure 33 Strategic Benchmarking: Inorganic Growth Strategies for Technology Integration and Product Enhancement
Figure 34 Holographic Display Market Segmentation, By Technology
Figure 35 Geographic Snapshot (2014)- the Rapidly Growing Markets Are Emerging as the New Hot Spots
Figure 36 Country-Wise Growth for the Holographic Display Applications Segment
Figure 37 The North American Market Snapshot: Demand Will Be Driven By the Requirement of
Figure 38 Asia-Pacific Holographic Display Market Snapshot — China is the Most Lucrative Market
Figure 39 Companies Adopted Partnerships and Agreements as the Key Growth Strategy Over the Last Three Years
Figure 40 Market Evaluation Framework- the Significant Product Development Through Partnerships Has Fueled the Growth and Innovation
Figure 41 Battle for the Market Share: New Product Launches Was the Key Strategy
Figure 42 Geographic Revenue Mix of Top Four Players
Figure 43 AV Concepts: Business Overview
Figure 44 EON Reality: Business Overview
Figure 45 EON Reality: SWOT Analysis
Figure 46 Konica Minolta: Business Overview
Figure 47 Konica Monilta: SWOT Analysis
Figure 48 Qualcomm Incorporated: Business Overview
Figure 49 Qualcomm Inc. : SWOT Analysis
Figure 50 Zebra Imaging: Business Overview
Figure 51 Zebra Imaging: SWOT Analysis
Figure 52 Holoxica Limited: Business Overview
Figure 53 Musion Das Hologram Ltd.: Business Overview
Figure 54 Provision Holdings, Inc. : Company Snapshot
Figure 55 Realview Imaging Ltd.: Business Overview
Figure 56 Viewsonic Corporation
Figure 57 Viewsonic Corporation: SWOT Analysis
プレスリリース
プレスリリース
 当レポートのプレスリリースは発行されておりません。
 リサーチカテゴリ一覧
 スマートグリッド


 お問合わせはこちらから