
 HOME
HOME 市場調査レポート
皮膚科用医療機器(診断・治療)の世界市場:2019年市場予測
Dermatology Devices Market by Diagnostic Devices (Dermatoscope, Microscope, Imaging Techniques), Treatment Devices (Liposuction, Microdermabrasion, Lasers) & by Application (Cancer Diagnosis, Acne, Psoriasis, Hair Removal) - Global Forecast to 2019
- 出版元:MarketsandMarkets(米国)
- 発行年:2015年1月
- 定価 Single User License(1名様ライセンス)US$5,650(米国ドル)/Multi User License(5名様)$6,650 /Corporate User License $8,150
- ご請求は円換算(お見積り日TTSレート)となります。
- 納品形態:PDF by Email
- 当調査レポートは英文になります。
- 商品コード:MAM038
お問い合わせ、お見積りのリクエストは下のボタンをクリックしてご入力ください。


【レポート紹介】
皮膚科用医療機器(Dermatology Device)の世界市場は、2014年に65億7823万ドルに達し、2019年には113億3700万ドル規模になると予測されます。2012年から2019年までの市場の年平均成長率は11.50%と見込まれます。皮膚疾患発生率の増加傾向、美容療法施術への認知度向上、機器の技術的進化や医療支出の増加などは市場の促進要因となっています。一方、コスト回収や厳格な当局規制などが市場成長の課題として挙げられます。
当レポートでは、皮膚科用医療機器の世界市場を詳細に調査分析、各種セグメントでの2019年に至る市場規模予測、動向分析、主要企業情報などを概略以下の構成でお届けいたします。
<セグメント別市場予測~2019年、分析>
●皮膚科用診断機器、タイプ別
・ダーマトスコープ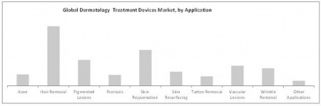
・顕微鏡
・イメージング技術
●皮膚科治療機器、タイプ別
・電気手術機器
・脂肪吸引装置
・マイクロダーマブレーション
・凍結療法機器
・ライトセラピーデバイス
・レーザー
●診断機器、用途別
・皮膚がん診断
・その他診断
●治療機器、用途別
・脱毛
・スキンリジュビネーションskin rejuvenation
・色素性病変
・にきび
・血管病変
・しわ除去
・スキンリサーフェイシング
・乾癬
・タトゥー除去
・その他の治療用途
●国・地域別
・北米地域
・カナダ
・米国
・欧州地域
・アジア地域
・中国
・インド
・日本
・その他アジア
・その他地域Rest of the World
※地域別、用途別のクロスデータ掲載もあります。詳細は目次、データ項目一覧(List of Tables)を参照ください。
<主要企業情報>
Alma Lasers, Ltd.
Cutera, Inc.
Cynosure, Inc.
Lumenis, Ltd.
Solta Medical, Inc.
Gen, Inc.
Bruker Corporation
Carl Zeiss
Genesis Biosystems, Inc.
Heine Optotechnik Gmbh & Co. Kg
Michelson Diagnostics, Ltd.
Photomedex, Inc.
【レポート詳細目次、データ項目一覧(List of Tables)は当ページ下を参照ください】
英文詳細目次(table of contents)
【原文詳細目次】
Dermatology Devices Market by Diagnostic Devices (Dermatoscope, Microscope, Imaging Techniques), Treatment Devices (Liposuction, Microdermabrasion, Lasers) & by Application (Cancer Diagnosis, Acne, Psoriasis, Hair Removal) - Global Forecast to 2019
Table of Contents
1 Introduction (Page No. - 16)
1.1 Objectives of the Study
1.2 Market Definition
1.3 Market Scope
1.3.1 Markets Covered
1.3.2 Years Considered for the Study
1.4 Currency
1.5 Stakeholders
2 Research Methodology (Page No. - 20)
2.1 Market Size Estimation
2.2 Market Breakdown and Data Triangulation
2.3 Market Share Estimation
2.3.1 Key Data From Secondary Sources
2.3.2 Key Data From Primary Sources
2.3.3 Assumptions
3 Executive Summary (Page No. - 26)
4 Premium Insights (Page No. - 32)
4.1 Lucrative Opportunities in the Global Dermatology Devices Market
4.2 Life Cycle Analysis, By Region
5 Market Overview (Page No. - 36)
5.1 Introduction
5.2 Market Segmentation
5.2.1 Global Dermatology Diagnostic Devices Market, By Type
5.2.2 Global Dermatology Treatment Devices Market, By Type
5.2.3 Global Dermatology Diagnostic Devices Market By Application
5.2.4 Global Dermatology Treatment Devices Market By Application
5.3 Market Dynamics
5.3.1 Drivers
5.3.1.1 Rising Incidence of Skin Disorders is the Primary Driver for the Dermatology Devices Market
5.3.1.2 Increasing Awareness on Aesthetic Procedures
5.3.1.3 Technological Advancements
5.3.1.4 Increasing Healthcare Expenditure
5.3.2 Restraints
5.3.2.1 Reimbursement Issues
5.3.2.2 Stringent Regulatory Policies for Medical Devices
5.3.3 Opportunities
5.3.3.1 Emerging Economies
5.3.4 Threats
5.3.4.1 Competitive Pricing By Low-Cost Manufacturers and Availability of Low-Cost Substitutes
6 Industry Insights (Page No. - 46)
6.1 Introduction
6.2 Porter’s Five Forces Analysis
6.2.1 Threat From New Entrants
6.2.2 Threat From Substitutes
6.2.3 Bargaining Power of Buyers
6.2.4 Bargaining Power of Suppliers
6.2.5 Intensity of Rivalry
6.3 Strategic Benchmarking
6.4 Supply Chain Analysis
6.4.1 Key Influencers
7 Dermatology Diagnostic Devices Market, By Type (Page No. - 51)
7.1 Introduction
7.2 Imaging Techniques
7.3 Dermatoscopes
7.4 Microscopes
8 Dermatology Treatment Device Market, By Type (Page No. - 59)
8.1 Introduction
8.2 Light Therapy Devices
8.3 Lasers
8.4 Electrosurgical Equipment
8.5 Liposuction Devices
8.6 Microdermabrasion
8.7 Cryotherapy Devices
9 Dermatology Treatment Devices Market, By Application (Page No. - 73)
9.1 Introduction
9.2 Treatment Applications
9.2.1 Hair Removal
9.2.2 Skin Rejuvenation
9.2.3 Pigmented Lesions
9.2.4 Vascular Lesions
9.2.5 Wrinkle Removal
9.2.6 Skin Resurfacing
9.2.7 ACNE
9.2.8 Psoriasis
9.2.9 Tattoo Removal
9.2.10 Other Treatment Applications
9.3 Dermatology Diagnostic Devices, By Application
9.3.1 Skin Cancer Diagnosis
9.3.2 Other Diagnostic Applications
10 Geographic Analysis (Page No. - 96)
10.1 Introduction
10.2 North America
10.2.1 U.S.
10.2.2 Canada
10.3 Europe
10.4 Asia
10.4.1 Japan
10.4.2 China
10.4.3 India
10.4.4 Rest of Asia
10.5 Rest of the World
11 Competitive Landscape (Page No. - 147)
11.1 Overview
11.2 Leading Players, Dermatology Devices Market
11.3 Competitive Situation and Trends
11.3.1 New Product Launches
11.3.2 Mergers and Acquisitions
11.3.3 Agreements, Partnerships, and Collaborations
11.3.4 Expansions
11.3.5 Other Developments
12 Company Profiles (Page No. - 156)
12.1 Introduction
12.2 Alma Lasers, Ltd.
12.2.1 Business Overview
12.2.2 Product Portfolio
12.2.3 Recent Developments
12.2.4 MNM View
12.2.4.1 Financial Analysis
12.2.4.2 Strategic Analysis
12.3 Cutera, Inc.
12.3.1 Business Overview
12.3.2 Product Portfolio
12.3.3 Recent Developments
12.3.4 MNM View
12.3.4.1 Financial Analysis
12.3.4.2 Strategic Analysis
12.4 Cynosure, Inc.
12.4.1 Business Overview
12.4.2 Product Portfolio
12.4.3 Recent Developments
12.4.4 MNM View
12.4.4.1 Financial Analysis
12.4.4.2 Strategic Analysis
12.5 Lumenis, Ltd.
12.5.1 Business Overview
12.5.2 Product Portfolio
12.5.3 Recent Developments
12.5.4 MNM View
12.5.4.1 Financial Analysis
12.5.4.2 Strategic Analysis
12.6 Solta Medical, Inc.
12.6.1 Business Overview
12.6.2 Product Portfolio
12.6.3 Recent Developments
12.6.4 MNM View
12.6.4.1 Financial Analysis
12.6.4.2 Strategic Analysis
12.7 Gen, Inc.
12.7.1 Business Overview
12.7.2 Product Portfolio
12.7.3 Recent Developments
12.8 Bruker Corporation
12.8.1 Business Overview
12.8.2 Product Portfolio
12.8.3 Key Strategy
12.8.4 Recent Developments
12.9 Carl Zeiss
12.9.1 Business Overview
12.9.2 Product Portfolio
12.9.3 Key Strategy
12.9.4 Recent Developments
12.10 Genesis Biosystems, Inc.
12.10.1 Business Overview
12.10.2 Product Portfolio
12.10.3 Key Strategy
12.10.4 Recent Developments
12.11 Heine Optotechnik Gmbh & Co. Kg
12.11.1 Business Overview
12.11.2 Product Portfolio
12.11.3 Recent Developments
12.12 Michelson Diagnostics, Ltd.
12.12.1 Business Overview
12.12.2 Product Portfolio
12.12.3 Key Strategy
12.12.4 Recent Developments
12.13 Photomedex, Inc.
12.13.1 Business Overview
12.13.2 Product Portfolio
12.13.3 Key Strategy
12.13.4 Recent Developments
13 Appendix (Page No. - 196)
13.1 Insights of Industry Experts
13.2 Discussion Guide
13.3 Introducing RT: Real-Time Market Intelligence
13.4 Available Customizations
13.5 Related Reports
List of Tables (78 Tables)
Table 1 Market Developments Between 2010 and 2014
Table 2 Global Dermatology Devices Market Size, By Product, 2012–2019 ($Million)
Table 3 Dermatology Devices Market Size for Imaging Techniques, By Region, 2012-2019 ($ Million)
Table 4 Dermatoscopes Market Size, By Type, 2012-2019 ($Million)
Table 5 Dermatology Diagnostic Devices Market Size for Dermatoscopes , By Region, 2012–2019 ($Million)
Table 6 Dermatology Diagnostic Devices Market Size for Microscopes, By Region, 2012-2019 ($Million)
Table 7 Global Dermatology Treatment Devices Market Size, By Product, 2012–2019 ($Million)
Table 8 Dermatology Treatment Devices Market Size for Light Therapy Devices, By Region, 2012–2019 ($Million)
Table 9 Dermatology Devices Market Size for Lasers, By Region, 2012–2019 ($Million)
Table 10 Dermatology Devices Market Size for Electrosurgical Equipment, By Region, 2012–2019 ($Million)
Table 11 Dermatology Devices Market Size for Liposuction Devices , By Region, 2012–2019 ($Million)
Table 12 Dermatology Treatment Devices Market Size for Microdermabrasion, By Region, 2012–2019 ($Million)
Table 13 Dermatology Treatment Devices Market Size for Cryotherapy Devices, By Region, 2012–2019 ($Million)
Table 14 Dermatology Devices Market Size, By Application, 2012–2019 ($Million)
Table 15 Dermatology Devices Market Size, By Application, 2012–2019 ($Million)
Table 16 Dermatology Devices Market Size for Hair Removal Application, By Region, 2012–2019 ($Million)
Table 17 Dermatology Devices Market Size for Skin Rejuvenation Application, By Region, 2012–2019 ($Million)
Table 18 Dermatology Devices Market Size for Pigmented Lesions Application, By Region, 2012–2019 ($Million)
Table 19 Dermatology Devices Market Size for Vascular Lesions Application, By Region, 2012–2019 ($Million)
Table 20 Dermatology Devices Market Size for Wrinkle Removal Application, By Region, 2012–2019 ($Million)
Table 21 Market Size for Skin Resurfacing Application, By Region, 2012–2019 ($Million)
Table 22 Market Size for ACNE Application, By Region, 2012–2019 ($Million)
Table 23 Dermatology Devices Market Size for Psoriasis Application, By Region, 2012–2019 ($Million)
Table 24 Dermatology Devices Market Size for Tattoo Removal Application, By Region, 2012–2019 ($Million)
Table 25 Dermatology Devices Market Size for Other Treatment Applications, By Region, 2012–2019 ($Million)
Table 26 Global Dermatology Diagnostic Devices Market Size, By Application, 2012–2019 ($Million)
Table 27 Dermatology Diagnostic Devices Market Size for Skin Cancer Diagnosis, By Region, 2012–2019 ($Million)
Table 28 Global Dermatology Diagnostic Devices Market Size for Other Diagnostic Applications, By Region, 2012–2019 ($Million)
Table 29 Dermatology Devices Market Size, By Type, 2012–2019 ($Million)
Table 30 Dermatology Devices Market Size, By Region, 2012–2019 ($Million)
Table 31 North America: Dermatology Devices Market Size, By Geography, 2012–2019 ($Million)
Table 32 North America: Dermatology Devices Market Size, By Type, 2012–2019 ($Million)
Table 33 North America: Dermatology Devices Market Size, By Type, 2012–2019 ($Million)
Table 34 North America: Dermatology Diagnostic Devices Market Size, By Application, 2012–2019 ($Million)
Table 35 North America: Dermatology Treatment Devices Market Size, By Application, 2012–2019 ($Million)
Table 36 U.S.: Dermatology Devices Market Size, By Type, 2012–2019 ($Million)
Table 37 U.S.: Dermatology Devices Market Size, By Type, 2012–2019 ($Million)
Table 38 U.S.: Market Size, By Application, 2012–2019 ($Million)
Table 39 U.S.: Market Size, By Application, 2012–2019 ($Million)
Table 40 Canada: Dermatology Devices Market Size, By Type, 2012–2019 ($Million)
Table 41 Canada: Dermatology Treatment Devices Market Size, By Type, 2012–2019 ($Million)
Table 42 Canada: Dermatology Devices Market Size, By Application, 2012–2019 ($Million)
Table 43 Canada: Market Size, By Application, 2012–2019 ($Million)
Table 44 Europe: Dermatology Diagnostic Devices Market Size, By Type, 2012–2019 ($Million)
Table 45 Europe: Dermatology Devices Market Size, By Type, 2012–2019 ($Million)
Table 46 Europe: Dermatology Diagnostic Devices Market Size, By Application, 2012–2019 ($Million)
Table 47 Europe: Dermatology Treatment Devices Market Size, By Application, 2012–2019 ($Million)
Table 48 Asia: Dermatology Devices Market Size, By Geography, 2012–2019 ($Million)
Table 49 Asia: Dermatology Diagnostic Devices Market Size, By Type, 2012–2019 ($Million)
Table 50 Asia: Dermatology Treatment Devices Market Size, By Type, 2012–2019 ($Million)
Table 51 Asia: Dermatology DevicesMarket Size, By Application, 2012–2019 ($Million)
Table 52 Asia: Market Size, By Application, 2012–2019 ($Million)
Table 53 Japan: Dermatology Diagnostic Devices Market Size, By Type, 2012–2019 ($Million)
Table 54 Japan: Dermatology Treatment Devices Market Size, By Type, 2012–2019 ($Million)
Table 55 Japan: Dermatology DevicesMarket Size, By Application, 2012–2019 ($Million)
Table 56 Japan: Dermatology DevicesMarket Size, By Application, 2012–2019 ($Million)
Table 57 China: Dermatology DevicesMarket Size, By Type, 2012–2019 ($Million)
Table 58 China: Market Size, By Type, 2012–2019 ($Million)
Table 59 China: Dermatology Devices Market Size, By Application, 2012–2019 ($Million)
Table 60 China: Dermatology DevicesMarket Size, By Application, 2012–2019 ($Million)
Table 61 India: Dermatology Devices Market Size, By Type, 2012–2019 ($Million)
Table 62 India: Market Size, By Type, 2012–2019 ($Million)
Table 63 India: Dermatology Devices Market Size, By Application, 2012–2019 ($Million)
Table 64 India: Dermatology Devices Market Size, By Application, 2012–2019 ($Million)
Table 65 ROA: Dermatology Devices Market Size, By Type, 2012–2019 ($Million)
Table 66 ROA: Dermatology Devices Market Size, By Type, 2012–2019 ($Million)
Table 67 ROA: Dermatology Devices Market Size, By Application, 2012–2019 ($Million)
Table 68 ROA: Dermatology Devices Market Size, By Application, 2012–2019 ($Million)
Table 69 ROW: Dermatology DevicesMarket Size, By Type, 2012–2019 ($Million)
Table 70 ROW: Market Size, By Type, 2012–2019 ($Million)
Table 71 ROW: Dermatology Devices Market Size, By Application, 2012–2019 ($Million)
Table 72 ROW: Dermatology Devices Market Size, By Application, 2012–2019 ($Million)
Table 73 Rank of Companies in the Global Dermatology Devices Market
Table 74 New Product Launches, 2011–2014
Table 75 Mergers and Acquisitions, 2011–2014
Table 76 Agreements, Collaborations, and Partnerships, 2011–2014
Table 77 Expansions, 2011–2014
Table 78 Other Developments, 2011–2014
List of Figures (129 Figures)
Figure 1 Dermatology Devices Market
Figure 2 Research Methodology
Figure 3 Market Size Estimation Methodology: Bottom-Up Approach
Figure 4 Market Size Estimation Methodology: Top-Down Approach
Figure 5 Break Down of Primary Interviews: By Company Type, Designation, and Region
Figure 6 Data Triangulation Methodology
Figure 7 Dermatology Treatment Devices is Expected to Be the Fastest-Growing Product Segment in the Forecast Period
Figure 8 Imaging Techniques Accounted for the Largest Share of the Dermatology Diagnostic Devices Market in 2014
Figure 9 Lasers is Expected to Be the Fastest-Growing Segment of the Dermatology Treatment Devices Market During the Forecast Period
Figure 10 Skin Cancer Diagnosis is the Largest and Fastest-Growing Application Segment of the Dermatology Diagnostic Devices Market
Figure 11 Skin Rejuvenation to Be the Fastest-Growing Application Segment of the Dermatology Treatment Devices Market During the Forecast Period
Figure 12 Asia Expected to Grow at the Highest Rate in the Global Dermatology Devices Market During the Forecast Period
Figure 13 U.S. is Expected to Be the Largest and Fastest-Growing Segment of the North American Dermatology Devices Market
Figure 14 China is Expected to Dominate the Asian Dermatology Devices Market
Figure 15 Increasing Incidence of Skin Cancer – an Important Growth Driver for Dermatology Devices
Figure 16 Dermatology Treatment Devices to Account for the Largest Market Share in 2014
Figure 17 Asia to Witness Fastest Growth During the Forecast Period (2014–2019)
Figure 18 Asia Holds Lucrative Growth Opportunities
Figure 19 Global Dermatology Devices Market Segmentation: By Type
Figure 20 Global Dermatology Treatment Devices Market Segmentation: By Type
Figure 21 Global Dermatology Diagnostic Devices Market Segmentation: By Application
Figure 22 Market Segmentation: By Application
Figure 23 Market Dynamics
Figure 24 Increasing Incidence of Skin Melanoma
Figure 25 Increasing Demand for Aesthetic Procedures to Drive Market Growth
Figure 26 Increasing Healthcare Expenditure is the Most Important Driver of the Dermatology Devices Market
Figure 27 Growth in Healthcare Expenditure in Asia and ROW Outpacing That in Europe and North America
Figure 28 High Capital Investment and Stringent Regulatory Policies to Restrict Entry of New Players
Figure 29 Direct Distribution—Strategy Preferred By Prominent Companies
Figure 30 Market Segmentation, By Type
Figure 31 Market Size, By Type, 2014, (Market Size and Growth Rate)
Figure 32 North America Dominates Imaging Techniques Segment in 2014
Figure 33 Asia Will Be the Fastest-Growing Regional Market for Dermatoscopes By 2019
Figure 34 North America Commands Largest Share of Microscopes Market in 2014 57
Figure 35 U.S.: Dermatology Cosmetic Procedures, 2013
Figure 36 U.S.: Top 5 Surgical Cosmetic Procedures, 2013
Figure 37 U.S.: Top 5 Nonsurgical Cosmetic Procedures, 2013
Figure 38 Dermatology Treatment Devices Market Segmentation, By Type
Figure 39 Dermatology Treatment Devices Market, By Type, 2014 (Market Size and Growth Rate)
Figure 40 North America to Command the Largest Share of the Light Therapy Devices Segment in 2014
Figure 41 The Lasers Segment is Expected to Witness the Highest Growth in the Dermatology Treatment Devices Market
Figure 42 Increasing Incidence of Skin Disorders Will Drive the Electrosurgical Equipment Market in North America
Figure 43 Asia is Expected to Be the Fastest-Growing Region for Liposuction Devices in 2014
Figure 44 North America to Dominate the Microdermabrasion Segment in 2014
Figure 45 Asia Will Be the Fastest-Growing Region for Cryotherapy Devices in 2014 70
Figure 46 Dermatology Devices Market, By Application
Figure 47 Dermatology Treatment Devices Market, By Application
Figure 48 Skin Resurfacing is Expected to Be the Fastest-Growing Application Segment of the Dermatology Treatment Devices Market
Figure 49 North America to Command the Largest Share of the Hair Removal Applications Market in 2014
Figure 50 Increasing Adoption of Data-Driven Technologies Will Drive the Skin Rejuvenation Application Segment in North America
Figure 51 North America is the Fastest-Growing Region for Pigmented Lesions in 2014 79
Figure 52 Increasing Skin Disorders Will Drive the Vascular Lesions Application Segment in 2014
Figure 53 North America to Dominate the Wrinkle Removal Application Market in 2014 82
Figure 54 Increasing Healthcare Expenditure Will Drive the Growth of the Skin Resurfacing Application in North America
Figure 55 Asia Will Be the Fastest-Growing Region for the ACNE Application Market in 2014
Figure 56 North America Commands the Largest Share to the Psoriasis Application Market in 2014
Figure 57 North America Commands the Largest Share to the Tattoo Removal Application Market in 2014
Figure 58 North America Commands the Largest Share to the Other Treatment Applications Market in 2014
Figure 59 Market, By Application
Figure 60 Global Dermatology Diagnostic Devices Market, By Application (Market Size & Growth Rate)
Figure 61 North America to Command the Largest Share of the Skin Cancer Diagnosis Segment
Figure 62 North America to Command the Largest Share of the Other Diagnostic Applications Segment
Figure 63 Market in Asia Expected to Grow at Highest Rate From 2014 to 2019
Figure 64 Dermatology Devices Market Size, By Type, 2014 vs. 2019 ($Million)
Figure 65 Dermatology Devices Market Size, By Region, 2014, (Market Size and Growth Rate)
Figure 66 North America: Market Snapshot
Figure 67 North America: Dermatology Devices Market Size, By Geography, 2014, (Market Size and Growth Rate)
Figure 68 North America: Market Size, By Type, 2014 vs. 2019 ($Million)
Figure 69 North America: Market Size, By Type, 2014 vs. 2019 ($Million)
Figure 70 North America: Market Size, By Application, 2014 vs. 2019 ($Million)
Figure 71 North America: Market Size, By Application, 2014 vs. 2019 ($Million)
Figure 72 U.S.: Dermatology Diagnostic Devices Market Size, By Type, 2014 vs. 2019 ($Million)
Figure 73 U.S.: Market Size, By Type, 2014 vs. 2019 ($Million)
Figure 74 U.S.: Market Size, By Application, 2014 vs. 2019 ($Million)
Figure 75 U.S.: Market Size, By Application, 2014 vs. 2019 ($Million)
Figure 76 Canada: Dermatology Treatment Devices Market Size, By Type, 2014 vs. 2019 ($Million)
Figure 77 Canada: Dermatology Devices Market Size, By Type, 2014 vs. 2019 ($Million)
Figure 78 Canada: Market Size, By Application, 2014 vs. 2019 ($Million)
Figure 79 Canada: Market Size, By Application, 2014 vs. 2019 ($Million)
Figure 80 Europe: Dermatology Devices Market Size, By Type, 2014 vs. 2019 ($Million)
Figure 81 Europe: Market Size, By Type, 2014 vs. 2019 ($Million)
Figure 82 Europe: Market Size, By Application, 2014 vs. 2019 ($Million)
Figure 83 Europe: Market Size, By Application, 2014 vs. 2019 ($Million)
Figure 84 Asia: Dermatology Treatment Devices Market Snapshot
Figure 85 Asia: Dermatology Devices Market Size, By Geography, 2014, (Market Size and Growth Rate)
Figure 86 Asia: Dermatology Diagnostic Devices Market Size, By Type, 2014 vs. 2019 ($Million)
Figure 87 Asia: Market Size, By Type, 2014 vs. 2019 ($Million)
Figure 88 Asia: Market Size, By Application, 2014 vs. 2019 ($Million)
Figure 89 Asia: Market Size, By Application, 2014 vs. 2019 ($Million)
Figure 90 Japan: Dermatology Devices Market Size, By Type, 2014 vs. 2019 ($Million)
Figure 91 Japan: Dermatology Treatment Devices Market Size, By Type, 2014 vs. 2019 ($Million)
Figure 92 Japan: Dermatology Diagnostic Devices Market Size, By Application, 2014 vs. 2019 ($Million)
Figure 93 Japan: Market Size, By Application, 2014 vs. 2019 ($Million)
Figure 94 China: Market Size, By Type, 2014 vs. 2019 ($Million)
Figure 95 China: Market Size, By Type, 2014 vs. 2019 ($Million)
Figure 96 China: Market Size, By Application, 2014 vs. 2019 ($Million)
Figure 97 China: Market Size, By Application, 2014 vs. 2019 ($Million)
Figure 98 India: Dermatology Devices Market Size, By Type, 2014 vs. 2019 ($Million)
Figure 99 India: Market Size, By Type, 2014 vs. 2019 ($Million)
Figure 100 India: Market Size, By Application, 2014 vs. 2019 ($Million)
Figure 101 India: Market Size, By Application, 2014 vs. 2019 ($Million)
Figure 102 ROA: Dermatology Diagnostic Devices Market Size, By Type, 2014 vs. 2019 ($Million)
Figure 103 ROA: Market Size, By Type, 2014 vs. 2019 ($Million)
Figure 104 ROA: Market Size, By Application, 2014 vs. 2019 ($Million)
Figure 105 ROA: Market Size, By Application, 2014 vs. 2019 ($Million)
Figure 106 ROW: Market Size, By Type, 2014 vs. 2019 ($Million)
Figure 107 ROW: Dermatology Treatment Devices Market Size, By Type, 2014 vs. 2019 ($Million)
Figure 108 ROW: Market Size, By Application, 2014 vs. 2019 ($Million)
Figure 109 ROW: Dermatology Treatment Devices Market Size, By Application, 2014 vs. 2019 ($Million)
Figure 110 New Product Launches Are the Key Strategy Adopted By Players
Figure 111 Battle for Market Share: New Product Launches Was the Key Strategy
Figure 112 New Product Launches, 2011–2014
Figure 113 Mergers and Acquisitions, 2011–2014
Figure 114 Agreements, Collaborations, and Partnerships, 2011–2014
Figure 115 Expansions, 2011–2014
Figure 116 Other Developments, 2011–2014
Figure 117 Geographic Revenue Mix of Top 5 Market Players
Figure 118 Company Snapshot
Figure 119 Company Snapshot
Figure 120 Company Snapshot
Figure 121 Company Snapshot
Figure 122 Company Snapshot
Figure 123 Company Snapshot
Figure 124 Company Snapshot
Figure 125 Company Snapshot
Figure 126 Company Snapshot
Figure 127 Company Snapshot
Figure 128 Company Snapshot
Figure 129 Company Snapshot
プレスリリース
プレスリリース
 当レポートのプレスリリースは発行されておりません。
 リサーチカテゴリ一覧
 スマートグリッド


 お問合わせはこちらから