
 HOME
HOME 市場調査レポート
臨床化学分析装置・試薬の世界市場:2019年市場予測
Clinical Chemistry Analyzer Market by Product (Systems & Reagents), Test Type (Basic Metabolic, Electrolyte, Liver, Lipid, Renal, Thyroid Function, Specialty Chemicals), End User (Hospitals, Laboratories, Academic Research) - Global Forecast to 2019
- 出版元:MarketsandMarkets(米国)
- 発行年:2014年10月
- 定価 Single User License(1名様ライセンス)US$5,650(米国ドル)/Multi User License(5名様)$6,650 /Corporate User License $8,150
- ご請求は円換算(お見積り日TTSレート)となります。
- 納品形態:PDF by Email
- 当調査レポートは英文になります。
- 商品コード:MAM044
お問い合わせ、お見積りのリクエストは下のボタンをクリックしてご入力ください。


【レポート紹介】
臨床化学分析装置の世界市場は2014年に89億6500万ドル規模に達し、以後年平均5.52%で成長を続け2019年に117億2800万ドル規模になると予測されます。診断(健診)市場の急成長、医療費の増大、生活習慣病の発生率の上昇などは同市場の促進要因となっています。さらに予防医療の認知度向上、高齢人口の増加、研究所オートメーション(laboratory automation)への需要拡大なども臨床化学分析製品の需要につながると見られます。
当レポートでは、同世界市場を詳細に調査分析、各種セグメントでの2019年に至る市場規模予測、動向分析、主要企業情報などを概略以下の構成でお届けいたします。
<セグメント別、詳細市場予測(~2019年)および分析>
●製品セグメント別
・分析装置(Analyzers)サイズ・テストクラス別
- 小型400-800 Test/H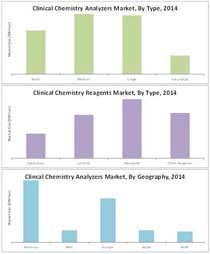
- 中型800-1200 Tests/H
- 大型1200-2000 Tests/H
- 特大型2000 Tests/H
・試薬(Reagents)セグメント別
- キャリブレーター
- コントロール
- 標準品(Standards)
- その他試薬
●検査セグメント別
・基本的な代謝パネル
・電解質パネル(測定)
・肝パネル
・脂質プロファイル
・腎パネル
・甲状腺機能パネル
●エンドユーザー別
・学術研究機関
・診断(検査)ラボラトリーDiagnostics Laboratories
・病院
・その他ユーザー
●地域別
・アメリカ地域
- 米国
- カナダ
- メキシコ
- チリ
- その他アメリカ
・BRIC諸国
- ブラジル
- 中国
- インド
- ロシア
・欧州
- フランス
- ドイツ
- イタリア
- スペイン
- 英国
- その他欧州
・日本
・その他地域(Rest of the World)
<主要企業情報>
Abbott Laboratories
Danaher Corporation
F. Hoffmann-La Roche Ltd.
Johnson & Johnson
Siemens AG
Elitech Group
Horiba, Ltd.
Mindray Medical International Limited
Randox Laboratories Ltd.
Thermo Fisher Scientific Inc.
【レポート詳細目次、データ項目一覧(List of Tables)は当ページ下を参照ください】
英文詳細目次(table of contents)
【原文詳細目次】
Clinical Chemistry Analyzer Market by Product (Systems & Reagents), Test Type (Basic Metabolic, Electrolyte, Liver, Lipid, Renal, Thyroid Function, Specialty Chemicals), End User (Hospitals, Laboratories, Academic Research) - Global Forecast to 2019
Table of Contents
1 Introduction (Page No. - 18)
1.1 Objectives Of The Study
1.2 Market Scope
1.2.1 Markets Covered
1.3 Stakeholders
2 Research Methodology (Page No. - 22)
2.1 Market Size Estimation
2.2 Market Crackdown And Data Triangulation
2.3 Market Share Estimation
2.3.1 Key Data From Secondary Sources
2.3.2 Key Data From Primary Sources
2.3.2.1 Key Industry Insights
2.3.3 Assumptions
3 Executive Summary (Page No. - 29)
4 Premium Insights (Page No. - 32)
4.1 Market To Grow At A Modest Rate
4.2 Life Cycle Analysis, By Region
5 Market Overview (Page No. - 35)
5.1 Introduction
5.2 Market Segmentation
5.2.1 Clinical Chemistry Analyzer Market, By Product
5.2.2 Clinical Chemistry Analyzer Market, By Test
5.2.3 Clinical Chemistry Analyzer Market, By End User
5.3 Market Dynamics
5.3.1 Drivers
5.3.1.1 Increasing Healthcare Expenditure
5.3.1.2 Rapidly Aging Population Is An Important Indirect Driver For This Market
5.3.1.3 Increasing Prevalence Of Lifestyle Diseases
5.3.1.4 Increase In Laboratory Automation
5.3.1.5 Rise In The Number Of Reagent Rental Agreements
5.3.1.6 Increase In Access To Medical Insurance In The U.S. Market
5.3.2 Restraints
5.3.2.1 Requirement Of High Capital Investments
5.3.2.2 Stringent Regulatory Policies For Medical Devices
5.3.2.3 High Degree Of Consolidation To Act As An Entry Barrier For New Entrants
5.3.3 Opportunities
5.3.3.1 Growing Opportunities In Emerging Economies
5.3.4 Trends
5.3.4.1 Quick Turnaround Times
5.3.4.2 High Throughput
5.3.4.3 Demand For Modular Automation
6 Industry Insights (Page No. - 43)
6.1 Introduction
6.2 Porter’s Five Forces Analysis
6.2.1 Threat From New Entrants
6.2.2 Threat From Substitutes
6.2.3 Bargaining Power Of Buyers
6.2.4 Bargaining Power Of Suppliers
6.2.5 Competitive Rivalry Among Existing Players
6.3 Strategic Benchmarking
6.3.1 New Product Launches
6.4 Supply Chain Analysis
6.4.1 Key Influencers
7 Clinical Chemistry Analyzers Market, By Product (Page No. - 48)
7.1 Introduction
7.2 Analyzers
7.3 Reagents
7.4 Other Products
8 Clinical Chemistry Analyzers Market, By Test (Page No. - 56)
8.1 Introduction
8.2 Basic Metabolic Panels
8.3 Electrolyte Panels
8.4 Liver Panels
8.5 Lipid Profiles
8.6 Renal Profiles
8.7 Thyroid Function Panels
8.8 Specialty Chemical Tests
9 Clinical Chemistry Analyzers Market, By End Users (Page No. - 68)
9.1 Introduction
9.2 Academic Research Centers
9.3 Diagnostic Laboratories
9.4 Hospitals
9.5 Other End Users
10 Geographic Analysis (Page No. - 75)
10.1 Introduction
10.2 The Americas
10.2.1 Canada
10.2.2 Chile
10.2.3 Mexico
10.2.4 U.S.
10.2.5 Rest Of The Americas (RoA)
10.3 BRIC
10.3.1 Brazil
10.3.2 China
10.3.3 India
10.3.4 Russia
10.4 Europe
10.4.1 France
10.4.2 Germany
10.4.3 Italy
10.4.4 Spain
10.4.5 U.K.
10.4.6 Rest Of Europe (RoE)
10.5 Japan
10.6 Rest Of The World (RoW)
11 Competitive Landscape (Page No. - 154)
11.1 Introduction
11.2 Market Share Analysis
11.3 Competitive Situation And Trends
11.3.1 New Product Launches
11.3.2 Acquisitions
11.3.3 Agreements, Partnerships, And Collaborations
11.3.4 Expansions
11.3.5 Other Developments
12 Company Profiles (Page No. - 162)
12.1 Introduction
12.2 Abbott Laboratories
12.3 Danaher Corporation
12.4 F. Hoffmann-La Roche Ltd.
12.5 Johnson & Johnson
12.6 Siemens AG
12.7 Elitech Group
12.8 Horiba, Ltd.
12.9 Mindray Medical International Limited
12.10 Randox Laboratories Ltd.
12.11 Thermo Fisher Scientific Inc.
*Details On Financials, Products & Services, Key Strategy, & Recent Developments Might Not Be Captured In Case Of Unlisted Companies.
13 Appendix (Page No. - 190)
13.1 Insights Of Industry Experts
13.2 Discussion Guide
13.3 Introducing Rt: Real-Time Market Intelligence
13.4 Available Customizations
13.5 Related Reports
List of Tables (76 Tables)
Table 1 Market Developments Between 2011 And 2014
Table 2 Global Clinical Chemistry Market Size, By Product, 2012–2019 ($Million)
Table 3 Clinical Chemistry Analyzers Market Size, By Capacity, 2012–2019 ($Million)
Table 4 Clinical Chemistry Analyzer Market Size, By Region, 2012–2019 ($Million)
Table 5 Clinical Chemistry Analyzer Market Size, By Test, 2012–2019 ($Million)
Table 6 Basic Metabolic Panel Tests Market Size, By Region, 2012–2019 ($Million)
Table 7 Electrolyte Panel Tests Market Size, By Region, 2012–2019 ($Million)
Table 8 Liver Panel Tests Market Size, By Region, 2012–2019 ($Million)
Table 9 Lipid Profile Tests Market Size, By Region, 2012–2019 ($Million)
Table 10 Renal Profile Tests Market Size, By Region, 2012–2019 ($Million)
Table 11 Thyroid Function Panel Tests Market Size, By Region, 2012–2019 ($Million)
Table 12 Specialty Chemical Tests Market Size, By Region, 2012–2019 ($Million)
Table 13 Clinical Chemistry Analyzer Market, By End User, 2012–2019 ($Million)
Table 14 Global Clinical Chemistry Market For Academic Research Institutes, By Region, 2012–2019 ($Million)
Table 15 Clinical Chemistry Analyzer Market For Diagnostic Laboratories, By Region, 2012–2019 ($Million)
Table 16 Global Clinical Chemistry Market For Hospitals, By Region, 2012–2019 ($Million)
Table 17 Global Clinical Chemistry Market For Other End Users, By Region, 2012–2019 ($Million)
Table 18 Clinical Chemistry Analyzers Market Size, By Region, 2012–2019 ($Million)
Table 19 The Americas: Clinical Chemistry Analyzer Market Size, By Country, 2012–2019 ($Million)
Table 20 The Americas: Market Size, By Product, 2012–2019 ($Million)
Table 21 The Americas: Market Size, By Capacity, 2012–2019 ($Million)
Table 22 The Americas: Market Size, By Test, 2012–2019 ($Million)
Table 23 The Americas: Market Size, By End User, 2012–2019 ($Million)
Table 24 Canada: Clinical Chemistry Analyzer Market Size, By Product, 2012–2019 ($Million)
Table 25 Canada: Market Size, By Capacity, 2012–2019 ($Million)
Table 26 Chile: Market Size, By Product, 2012–2019 ($Million)
Table 27 Chile: Market Size, By Capacity, 2012–2019 ($Million)
Table 28 Mexico: Market Size, By Product, 2012–2019 ($Million)
Table 29 Mexico: Market Size, By Capacity, 2012–2019 ($Million)
Table 30 U.S.: Market Size, By Product, 2012–2019 ($Million)
Table 31 U.S.: Market Size, By Capacity, 2012–2019 ($Million)
Table 32 RoA: Clinical Chemistry Analyzer Market Size, By Product, 2012–2019 ($Million)
Table 33 RoA: Market Size, By Capacity, 2012–2019 ($Million)
Table 34 BRIC: Market Size, By Country, 2012–2019 ($Million)
Table 35 BRIC: Market Size, By Product, 2012–2019 ($Million)
Table 36 BRIC: Market Size, By Capacity, 2012–2019 ($Million)
Table 37 BRIC: Market Size, By Test, 2012–2019 ($Million)
Table 38 BRIC: Market Size, By End User, 2012–2019 ($Million)
Table 39 Brazil: Market Size, By Product, 2012–2019 ($Million)
Table 40 Brazil: Market Size, By Capacity, 2012–2019 ($Million)
Table 41 China: Market Size, By Product, 2012–2019 ($Million)
Table 42 China: Market Size, By Capacity, 2012–2019 ($Million)
Table 43 India: Market Size, By Product, 2012–2019 ($Million)
Table 44 India: Market Size, By Capacity, 2012–2019 ($Million)
Table 45 Russia: Market Size, By Product, 2012–2019 ($Million)
Table 46 Russia: Market Size, By Capacity, 2012–2019 ($Million)
Table 47 Europe: Market Size, By Region, 2012–2019 ($Million)
Table 48 Europe: Market Size, By Product, 2012–2019 ($Million)
Table 49 Europe: Market Size, By Capacity, 2012–2019 ($Million)
Table 50 Europe: Market Size, By Test, 2012–2019 ($Million)
Table 51 Europe: Market Size, By End User, 2012–2019 ($Million)
Table 52 France: Market Size, By Product, 2012–2019 ($Million)
Table 53 France: Market Size, By Capacity, 2012–2019 ($Million)
Table 54 Germany: Market Size, By Product, 2012–2019 ($Million)
Table 55 Germany: Market Size, By Capacity, 2012–2019 ($Million)
Table 56 Italy: Market Size, By Product, 2012–2019 ($Million)
Table 57 Italy: Market Size, By Capacity, 2012–2019 ($Million)
Table 58 Spain: Market Size, By Product, 2012–2019 ($Million)
Table 59 Spain: Market Size, By Capacity, 2012–2019 ($Million)
Table 60 U.K.: Market Size, By Product, 2012–2019 ($Million)
Table 61 U.K.: Market Size, By Capacity, 2012–2019 ($Million)
Table 62 RoE: Market Size, By Product, 2012–2019 ($Million)
Table 63 RoE: Market Size, By Capacity, 2012–2019 ($Million)
Table 64 Japan: Market Size, By Product, 2012–2019 ($Million)
Table 65 Japan: Market Size, By Capacity, 2012–2019 ($Million)
Table 66 Japan: Market Size, By Test, 2012–2019 ($Million)
Table 67 Japan: Market Size, By End User, 2012–2019 ($Million)
Table 68 RoW: Market Size, By Product, 2012–2019 ($Million)
Table 69 RoW: Market Size, By Capacity, 2012–2019 ($Million)
Table 70 RoW: Market Size, By Test, 2012–2019 ($Million)
Table 71 RoW: Market Size, By End User, 2012–2019 ($Million)
Table 72 New Product Launches, 2011–2014
Table 73 Acquisitions, 2011–2014
Table 74 Agreements, Partnerships, And Collaborations, 2011–2014
Table 75 Expansions, 2011–2014
Table 76 Other Developments, 2011–2014
List of Figures (138 Figures)
Figure 1 Global Clinical Chemistry Analyzer Market
Figure 2 Research Methodology
Figure 3 Market Size Estimation Methodology: Bottom-Up Approach
Figure 4 Market Size Estimation Methodology: Top-Down Approach
Figure 5 Breakdown Of Primary Interviews: By Company Type, Designation, And Region
Figure 6 Data Triangulation Methodology
Figure 7 Reagents Is The Largest And Fastest-Growing Product Segment
Figure 8 Basic Metabolic Panel Is The Largest Test Segment In 2014
Figure 9 Hospitals Will Dominate The Clinical Chemistry Analyzer Market By 2019 30
Figure 10 BRIC Is The Fastest-Growing Region In The Clinical Chemistry Analyzer Market
Figure 11 Increasing Healthcare Expenditure And Rising Demand From BRIC Are Important Growth Drivers
Figure 12 Reagents To Account For The Maximum Market Share In The Clinical Chemistry Analyzer Market
Figure 13 BRIC To Grow At The Highest Rate During The Forecast Period
Figure 14 BRIC Market Showcases Lucrative Growth Opportunities
Figure 15 Market Segmentation: By Product
Figure 16 Market Segmentation: By Test
Figure 17 Market Segmentation: By End User
Figure 18 Increase In Healthcare Expenditure Will Be The Primary Growth Driver In This Market
Figure 19 Increasing Healthcare Expenditure Is The Most Important Driver For The Clinical Chemistry Analyzer Market
Figure 20 Population Of People Over 65 Years Is Increasing At Close To Twice The Rate Of The General Population
Figure 21 Growth In Healthcare Expenditure In BRIC And RoW Outpacing That In Americas And Europe
Figure 22 Porter’s Five Forces Analysis
Figure 23 Most Market Players Adopted Organic Growth Strategy Of New Product Launches Between 2011 And 2014
Figure 24 Supply Chain Analysis
Figure 25 Clinical Chemistry Analyzer Market, By Product
Figure 26 Market Share, By Product, 2012–2019
Figure 27 Market Segmentation, By Capacity
Figure 28 Clinical Chemistry Analyzer Market Size, By Capacity, 2012–2019 ($Million)
Figure 29 Clinical Chemistry Reagents Market Size, By Region, 2012–2019 ($Million)
Figure 30 Clinical Chemistry Reagents Market Size, By Region, 2012–2019 ($Million)
Figure 31 Clinical Chemistry Other Products Market Size, By Region, 2012–2019 ($Million)
Figure 32 Clinical Chemistry Other Products Market Size, By Region, 2012–2019 ($Million)
Figure 33 Clinical Chemistry Analyzer Market, By Test
Figure 34 Clinical Chemistry Analyzer Market Size, By Test, 2014 (Market Size And Growth Rates)
Figure 35 Americas To Account For The Largest Share In The Basic Metabolic Panel Segment
Figure 36 Americas To Account For The Largest Share Of The Electrolyte Panel Test Segment
Figure 37 BRIC To Grow At The Highest CAGR In The Liver Panel Tests Market
Figure 38 Increased Obesity Rates To Aid The Growth Of The Lipid Profile Tests Segment
Figure 39 BRIC To Be The Fastest-Growing Market For Lipid Profile Tests
Figure 40 BRIC Is Expected To Be The Fastest-Growing Market For Renal Profile Tests
Figure 41 Americas Is The Largest Market For Thyroid Function Panel Tests
Figure 42 Americas Are The Largest Market For Specialty Chemical Tests
Figure 43 Clinical Chemistry Analyzer Market, By End User
Figure 44 Clinical Chemistry Analyzer Market Size, By End User, 2014 (Market Size And Growth Rates)
Figure 45 America Holds Largest Share Of Clinical Chemistry Analyzer Market For Academic Research Institutes
Figure 46 The Americas Holds Largest Share Of Clinical Chemistry Analyzer Market For Diagnostic Laboratories
Figure 47 BRIC Hospitals Segment Expected To Show Fastest Growth In Clinical Chemistry Analyzer Market
Figure 48 BRIC Regional Segment Shows Highest Growth In Clinical Chemistry Analyzer Market For Other End Users
Figure 49 Clinical Chemistry Analyzer Market, By Region
Figure 50 Global Economic Indicators (2003–2012)
Figure 51 Clinical Chemistry Analyzer Market, By Region (Market Size And Growth Rate), 2014-2019
Figure 52 Americas: Economic Indicators (2003–2012)
Figure 53 Americas: Market Snapshot
Figure 54 Americas: Clinical Chemistry Analyzer Market, By Region (Market Size And Growth Rate), 2014-2019
Figure 55 Reagents Are Estimated To Be The Largest Product Segment In The Americas In 2014
Figure 56 The Americas: Medium-Sized Analyzers To Grow At The Highest CAGR From 2014 To 2019
Figure 57 The Americas: Clinical Chemistry Market Size, By Test (Market Size And Growth Rate), 2014–2019
Figure 58 Hospitals To Account For The Largest Share Of The Clinical Chemistry Analyzers End-Users Market In The Americas
Figure 59 Canada: Economic Indicators (2003–2012)
Figure 60 Reagents Are The Largest And The Fastest-Growing Product Segment In Canada- 2014-2019
Figure 61 Small-Sized Analyzers To Be The Fastest-Growing Analyzers Segment In Canada- 2014-2019
Figure 62 Chile: Economic Indicators (2003–2012)
Figure 63 Reagents To Account For The Largest Share Of The Clinical Chemistry Market In Chile- 2014-2019
Figure 64 Chile: Small-Sized Analyzers To Grow At Highest CAGR From 2014-2019
Figure 65 Mexico: Economic Indicators (2003–2012)
Figure 66 Reagents To Be The Fastest-Growing Product Segment In Mexico
Figure 67 Mexico: Small-Sized Analyzers To Witness The Highest Growth
Figure 68 U.S.: Economic Indicators (2003–2012)
Figure 69 Reagents Are The Largest Product Segment In The U.S.
Figure 70 U.S.: Medium-Sized Analyzers To Witness Highest Growth
Figure 71 RoA: Economic Indicators (2003–2012)
Figure 72 Reagents To Be The Fastest-Growing Product Segment In The RoA
Figure 73 RoA: Small-Sized Analyzers To Grow At Highest CAGR
Figure 74 BRIC: Economic Indicators (2003–2012)
Figure 75 BRIC: Clinical Chemistry Analyzers Market, By Country (Market Size And Growth Rate), 2014-2019
Figure 76 Reagents To Account For The Largest Share Of The Clinical Chemistry Analyzers Market In BRIC In 2014
Figure 77 BRIC: Small-Sized Analyzers To Witness Highest CAGR
Figure 78 Lipid Profile Is The Fastest-Growing Test Segment In BRIC Between 2014 And 2019
Figure 79 Hospitals Are The Largest And The Fastest-Growing End-User Segment In BRIC
Figure 80 Brazil: Economic Indicators (2003–2012)
Figure 81 Brazil: The Reagents Segment To Witness Highest Growth
Figure 82 Brazil: Small-Sized Analyzers To Grow At The Highest CAGR
Figure 83 China: Economic Indicators (2003–2012)
Figure 84 Reagents Are The Largest Product Segment In China
Figure 85 China: Small-Sized Analyzers To Grow At The Highest CAGR
Figure 86 India: Economic Indicators (2003–2012)
Figure 87 Reagents Are The Largest And The Fastest-Growing Product Segment In India
Figure 88 India: Small-Sized Analyzers To Witness Highest Growth
Figure 89 Russia: Economic Indicators (2003–2012)
Figure 90 Reagents To Be The Fastest-Growing Product Segment In Russia
Figure 91 Small-Sized Analyzers To Be The Fastest-Growing Analyzer Segment In Russia
Figure 92 Europe: Economic Indicators (2003–2012)
Figure 93 Europe: Market Snapshot
Figure 94 Europe: Clinical Chemistry Analyzer Market, By Region, 2014-2019 (Market Size And Growth Rates)
Figure 95 Reagents Are The Largest Revenue Contributors To Clinical Chemistry Analyzer Market In Europe In 2014
Figure 96 Medium-Sized Analyzers To Hold Largest Market Share In Europe
Figure 97 Lipid Profile To Be Fastest-Growing Test Segment Of Clinical Chemistry Analyzers Market In Europe
Figure 98 Hospitals To Hold Largest Market Share In Europe
Figure 99 France: Economic Indicators (2003–2012)
Figure 100 Reagents To Witness Highest Growth In France By 2019
Figure 101 Medium-Sized Analyzers Market To Witness Highest Growth
Figure 102 Germany: Economic Indicators (2003–2012)
Figure 103 Reagents To Witness Highest Growth Rate In Germany By 2019
Figure 104 Medium-Sized Analyzers Segment To Witness Highest Growth
Figure 105 Italy: Economic Indicators (2003–2012)
Figure 106 Reagents To Witness Highest Growth Rate In Italy By 2019
Figure 107 Small-Sized Analyzers To Be The Fastest-Growing Analyzers Segment In Italy
Figure 108 Spain: Economic Indicators (2003–2012)
Figure 109 Reagents To Witness Highest Growth Rate In Spain By 2019
Figure 110 Small-Sized Analyzers To Be The Fastest-Growing Analyzers Segment In Spain
Figure 111 U.K.: Economic Indicators (2003–2012)
Figure 112 Reagents To Witness Highest Growth Rate In The U.K. By 2019
Figure 113 Medium-Sized Analyzers To Be The Fastest-Growing Analyzers Segment In The U.K.
Figure 114 RoE: Economic Indicators (2003–2012)
Figure 115 Reagents To Witness Highest Growth Rate In RoE By 2019
Figure 116 Small-Sized Analyzers To Be Fastest-Growing Segment In RoE
Figure 117 Japan: Economic Indicators (2003–2012)
Figure 118 Reagents Are Estimated To Command Largest Share Of The Total Clinical Chemistry Analyzer Market In Japan In 2014
Figure 119 Medium-Sized Analyzers To Command Largest Market Share In Japan
Figure 120 Lipid Profiles To Be The Fastest-Growing Test Segment In Clinical Chemistry Analyzer Market In Japan
Figure 121 Hospitals To Command Largest Share Of End-User Market In Japan
Figure 122 RoW: Economic Indicators (2003–2012)
Figure 123 Reagents Command Largest Share Of Total Clinical Chemistry Analyzers Market In The RoW
Figure 124 Medium-Size Analyzers To Hold Largest Share In Europe
Figure 125 Lipid Profiles To Be The Fastest-Growing Test Segment In RoW
Figure 126 Hospitals To Command Largest Share Of End-User Market In RoW
Figure 127 Product Innovations Is The Key Strategy Adopted By Players In The Clinical Chemistry Analyzers Market
Figure 128 Market Share Analysis, By Key Player, 2014
Figure 129 New Product Launches Is The Key Growth Strategy
Figure 130 Geographic Revenue Mix Of Top 5 Market Players
Figure 131 Abbott Laboratories: Business Overview
Figure 132 Danaher Corporation: Business Overview
Figure 133 F. Hoffmann-La Roche Ltd.: Business Overview
Figure 134 Johnson & Johnson: Business Overview
Figure 135 Siemens AG: Business Overview
Figure 136 Horiba, Ltd.: Business Overview
Figure 137 Mindray Medical International Limited: Business Overview
Figure 138 Thermo Fisher Scientific Inc.: Business Overview
プレスリリース
プレスリリース
 当レポートのプレスリリースは発行されておりません。
 リサーチカテゴリ一覧
 スマートグリッド


 お問合わせはこちらから