
 HOME
HOME 市場調査レポート
血液検査製品・サービスの世界市場:2019年市場予測
Blood Screening Market by Technology (Nucleic Acid Amplification Test, ELISA, Rapid Test, Chemiluminescence Immunoassay, Next Generation Sequencing, Western Blotting), Product (Instrument, Reagent) & End User (Blood Bank, Hospital) - Forecasts to 2019
- 出版元:MarketsandMarkets(米国)
- 発行年:2015年3月
- 定価 Single User License(1名様ライセンス)US$5,650(米国ドル)/Multi User License(5名様)$6,650 /Corporate User License $8,150
- ご請求は円換算(お見積り日TTSレート)となります。
- 納品形態:PDF by Email
- 当調査レポートは英文206になります。
- 商品コード:MAM059
お問い合わせ、お見積りのリクエストは下のボタンをクリックしてご入力ください。


※当レポートには更新版(2022年予測)が発行されております。更新版は下記リンクよりご参照ください。
血液検査製品・サービスの世界市場:技術別、製品サービス別2021年予測
【レポート紹介】
血液検査製品・サービスの世界市場は2014年段階で15億ドルの市場規模と推計され、以後年平均10.4%成長を続け2019年に25億5000万ドル規模に達すると予測されます。この高成長の背景には、献血の増加傾向、供与血液の安全性への認知度向上、核酸増幅試験(NAT)の採用増加、輸血需要の増加、感染症の有病率上昇などを挙げることができるでしょう。地域的には北米地域、特に米国が大シェアを占めていますが、今後の成長率ではアジア地域が最大の成長市場となる見込みです。当レポートで対象とする市場は、検査機器(instruments)、試薬(reagents)、ソフトウェアとサービスです。レポートでは、同世界市場を詳細に調査分析、各種セグメントでの2019年に至る市場規模予測、動向分析、主要企業情報などを概略以下の構成でお届けいたします。
<セグメント別市場予測-2019年>
●技術別市場予測-2019
・核酸増幅試験(NAT)
- 転写媒介増幅TMA
- リアルタイムポリメラーゼ連鎖反応PCR
・ELISA
- 迅速検査Rapid Test (Card Methodology)
- 第1世代ELISA
- 第2世代ELISA
- 第3世代ELISA
- 第4世代ELISA
・酵素免疫測定法(EIA)および化学発光免疫測定法(CLIAs)
・次世代シーケンシング(NGS)
・ウエスタンブロットアッセイ
●製品・サービス別市場予測-2019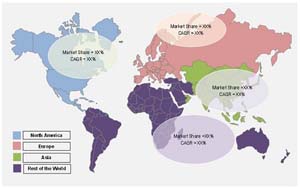
検査機器(Instruments hardware)
・レンタル購入
・買い切り
試薬(Reagents)
・ELISA試薬
- 免疫吸着剤
- コンジュゲート
- 基質
- コントロール
- サンプル希釈剤および洗浄溶液
・NAT試薬(核酸増幅試験)
- 酵素およびポリメラーゼ
- プローブおよびプライマー
- バッファ、ヌクレオチド、およびソリューション
- 標識および検出試薬
- 標準とコントロール
・他の試薬
ソフトウェアとサービス
●エンドユーザー別市場予測
・血液バンク
・病院
●国、地域別市場予測
・北米地域
- 米国
- カナダ
・欧州地域
- ドイツ
- フランス
- 英国
- イタリア
- スペイン
- その他欧州
・アジア
- 日本
- 中国
- インド
- その他アジア
・その他地域RoW
<主要企業動向>
・Grifols
・Roche Diagnostics (A Division of F. Hoffmann-La Roche Ltd)
・Abbott Laboratories
・Biomérieux
・Bio-Rad Laboratories, Inc.
・Siemens Healthcare (Subsidiary of Siemens AG)
・Ortho-Clinical Diagnostics, Inc.
・Thermo Fisher Scientific, Inc.
・Beckman Coulter (Subsidiary of Danaher Corporation)
・Becton, Dickinson and Company
【レポート詳細目次、データ項目一覧(List of Tables)は当ページ下を参照ください】
英文詳細目次(table of contents)
【原文詳細目次】
Blood Screening Market by Technology (Nucleic Acid Amplification Test, ELISA, Rapid Test, Chemiluminescence Immunoassay, Next Generation Sequencing, Western Blotting), Product (Instrument, Reagent) & End User (Blood Bank, Hospital) - Forecasts to 2019
Table of Contents
1 Introduction (Page No. - 18)
1.1 Objectives of the Study
1.2 Market Definition
1.3 Market Scope
1.3.1 Markets Covered
1.3.2 Years Considered for the Study
1.4 Currency
1.5 Stakeholders
2 Research Methodology (Page No. - 21)
2.1 Market Size Estimation
2.2 Market Breakdown and Data Triangulation
2.3 Market Share Estimation
2.4 Key Data From Secondary Sources
2.5 Key Data From Primary Sources
2.6 Key Industry Insights
2.7 Assumptions for the Study
3 Executive Summary (Page No. - 28)
4 Premium Insights (Page No. - 33)
4.1 Blood Screening Market, By Technology
4.2 By Products and Services
4.3 Blood Screening Reagents Market
4.4 Blood Screening ELISA Market
4.5 Blood Screening Market, By End User
4.6 Geographic Snapshot
5 Market Overview (Page No. - 34)
5.1 Introduction
5.2 Market Segmentation
5.2.1 Blood Screening Market Segmentation, By Technology
5.2.2 Market Segmentation, By Products and Services
5.2.3 Market Segmentation, By End User
5.2.4 Market Segmentation, By Region
5.3 Market Dynamics
5.3.1 Drivers
5.3.1.1 Increasing Number of Blood Donations and Blood Donors
5.3.1.2 Rising Awareness Regarding Safety of Donated Blood
5.3.1.3 Increase in Patient Affordability to Pay for NAT Tested Blood
5.3.1.4 Growing Adoption of NAT for Blood Screening
5.3.1.5 Increasing Demand of Donated Blood
5.3.1.6 Rising Prevalence of Infectious Diseases
5.3.2 Restraints
5.3.2.1 Capital Expenditure and Operating Cost of NAT Testing
5.3.2.2 Lack of Mandate for NAT in Developing Countries
5.3.2.3 Digital Immunoassay is New Alternative Technology
5.3.3 Opportunities
5.3.3.1 Pathogen Reduction Technology
5.3.3.2 Microbiology Screening
5.3.3.3 Multiplexing (Single Test for HIV, HBV, & HCV)
5.3.4 Challenges
5.3.4.1 Price Reduction
5.3.4.2 Lack of Trained Manpower
5.3.4.3 Regulatory Challenges
6 Industry Trends (Page No. - 48)
6.1 Supply Chain Analysis
6.2 Pest Analysis
6.2.1 Political Factors
6.2.2 Economic Factors
6.2.3 Social Factors
6.2.4 Technical Factors
6.3 Porter’s Five Force Analysis
6.3.1 Threat From New Entrants
6.3.2 Threat From Substitute Technologies
6.3.3 Bargaining Power of Suppliers
6.3.4 Bargaining Power of Buyers
6.3.5 Intensity of Competitive Rivalry
7 Blood Screening Market, By Technology (Page No. - 54)
7.1 Introduction
7.2 Blood Screening Market, By Volume (Number of Tests Conducted)
7.2.1 Transcription-Mediated Amplification
7.2.2 Real-Time Polymerase Chain Reaction (PCR)
7.3 Enzyme-Linked Immunosarbent Assay (ELISA)
7.3.1 Rapid Test (Card Methodology)
7.3.2 1st Generation ELISA
7.3.3 2nd Generation ELISA
7.3.4 3rd Generation ELISA
7.3.5 4th Generation ELISA
7.5 Next-Generation Sequencing (NGS)
7.6 Western Blot Assay
8 Blood Screening Market, By Products and Services (Page No. - 84)
8.1 Introduction
8.2 Instruments (Hardware)
8.2.1 Rental Purchase
8.2.2 Outright Purchase
8.3 Reagents
8.3.1 ELISA Reagents
8.3.1.1 Immunosorbent
8.3.1.2 Controls
8.3.1.3 Conjugate (Antigen Or Antibody Conjugated Enzyme)
8.3.1.4 Substrate (Substrate of Enzyme)
8.3.1.5 Sample Diluents and Wash Solutions
8.3.2 NAT Reagents
8.3.2.1 Enzymes and Polymerases
8.3.2.2 Standards and Controls
8.3.2.3 Probes & Primers
8.3.2.4 Buffers, Nucleotides, and Solutions
8.3.2.5 Labeling & Detection Reagents
8.3.3 Other Reagents
8.4 Software and Services
9 Blood Screening Market, By End User (Page No. - 105)
9.1 Introduction
9.2 Blood Banks
9.3 Hospitals
10 Blood Screening Market, By Region (Page No. - 112)
10.1 Introduction
10.1.1 North America
10.1.2 U.S.
10.1.3 Canada
10.2 Europe
10.2.1 Germany
10.2.2 France
10.2.3 U.K.
10.2.4 Italy
10.2.5 Spain
10.2.6 Rest of Europe (ROE)
10.3 Asia
10.3.1 Japan
10.3.2 China
10.3.3 India
10.3.4 Rest of Asia (ROA)
10.4 Rest of the World (ROW)
11 Competitive Landscape (Page No. - 158)
11.1 Overview
11.2 Market Share Analysis
11.2.1 Market Share Analysis for NAT
11.2.2 Market Share Analysis for Blood Screening
11.3 Competitive Situations and Trends
11.3.1 New Product Launches
11.3.2 Mergers and Acquisitions
11.3.3 Regulatory Approvals
11.3.4 Partnerships and Agreements
12 Company Profiles (Page No. - 166)
12.1 Introduction
12.2 Grifols
12.2.1 Business Overview
12.2.2 Product Portfolio
12.2.3 Key Strategy
12.2.4 Recent Developments
12.2.5 MNM View
12.3 Roche Diagnostics (A Division of F. Hoffmann-La Roche Ltd)
12.3.1 Business Overview
12.3.2 Product Portfolio
12.3.3 Key Strategy
12.3.4 Recent Developments
12.3.5 MNM View
12.4 Abbott Laboratories
12.4.1 Business Overview
12.4.2 Product Portfolio
12.4.3 Key Strategy
12.4.4 Recent Developments
12.4.5 MNM View
12.5 Biomérieux
12.5.1 Business Overview
12.5.2 Product Portfolio
12.5.3 Key Strategy
12.5.4 Recent Developments
12.5.5 MNM View
12.6 Bio-Rad Laboratories, Inc.
12.6.1 Business Overview
12.6.2 Product Portfolio
12.6.3 Key Strategy
12.6.4 Recent Developments
12.6.5 MNM View
12.7 Siemens Healthcare (Subsidiary of Siemens AG)
12.7.1 Business Overview
12.7.2 Product Portfolio
12.7.3 Key Strategy
12.7.4 Recent Developments
12.8 Ortho-Clinical Diagnostics, Inc.
12.8.1 Business Overview
12.8.2 Product Portfolio
12.8.3 Key Strategy
12.8.4 Recent Developments
12.9 Thermo Fisher Scientific, Inc.
12.9.1 Business Overview
12.9.2 Product Portfolio
12.9.3 Key Strategy
12.9.4 Recent Development
12.1 Beckman Coulter (Subsidiary of Danaher Corporation)
12.10.1 Business Overview
12.10.2 Product Portfolio
12.10.3 Key Strategy
12.10.4 Recent Developments
12.11 Becton, Dickinson and Company
12.11.1 Business Overview
12.11.2 Product Portfolio
12.11.3 Key Strategy
12.11.4 Recent Developments
13 Appendix (Page No. - 194)
List of Tables (197 Tables)
Table 1 Blood Screening Market Size, By Technology, 2012–2019 ($Million)
Table 2 Global Market, By Volume (Number of Tests), 2014
Table 3 North America: Blood Screening Market, By Volume (Number of Tests), 2014
Table 4 Europe: Market, By Volume (Number of Tests),2014
Table 5 Asia: Market, By Volume (Number of Tests), 2014
Table 6 Blood Screening NAT Technology Market Size, By Region, 2012–2019 ($Million)
Table 7 North America: Blood Screening NAT Technology Market Size, By Country, 2012–2019 ($Million)
Table 8 Europe: Blood Screening NAT Technology Market Size, By Country/Region, 2012–2019 ($Million)
Table 9 Asia: Blood Screening NAT Technology Market Size, By Country/Region, 2012–2019 ($Million)
Table 10 North America: Blood Screening NAT Technology Market Size, By Type, 2012–2019 ($Million)
Table 11 Transcription-Mediated Amplification Technology Market Size, By Region, 2012–2019 ($Million)
Table 12 North America: Transcription-Mediated Amplification Technology Market Size, By Country, 2012–2019 ($Million)
Table 13 Europe: Transcription-Mediated Amplification Technology Market Size, By Country/Region, 2012–2019 ($Million)
Table 14 Asia: Transcription-Mediated Amplification Technology Market Size, By Country/Region, 2012–2019 ($Million)
Table 15 Real-Time PCR Technology Market Size, By Region, 2012–2019 ($Million)
Table 16 North America: Real-Time PCR Technology Market Size, By Country, 2012–2019 ($Million)
Table 17 Europe: Real-Time PCR Technology Market Size, By Country/Region, 2012–2019 ($Million)
Table 18 Asia Real-Time PCR Technology Market Size, By Country/Region, 2012–2019 ($Million)
Table 19 ELISA Market Size, By Region, 2012–2019 ($Million)
Table 20 North America: ELISA Market Size, By Country, 2012–2019 ($Million)
Table 21 Europe: ELISA Market Size, By Country/Region, 2012–2019 ($Million)
Table 22 Asia: ELISA Market Size, By Country/Region, 2012–2019 ($Million)
Table 23 ELISA Market Size, By Type, 2012–2019 ($Million)
Table 24 Rapid Test (Card Methodology) Market Size, By Region, 2012–2019 ($Million)
Table 25 North America: Rapid Test (Card Methodology) Market Size, By Country, 2012–2019 ($Million)
Table 26 Europe: Rapid Test (Card Methodology) Market Size, By Country/Region, 2012–2019 ($Million)
Table 27 Asia: Rapid Test (Card Methodology) Market Size, By Country/Region, 2012–2019 ($Million)
Table 28 1st Generation ELISA Market Size, By Region, 2012–2019 ($Million)
Table 29 North America: 1st Generation ELISA Market Size, By Country, 2012–2019 ($Million)
Table 30 Europe: 1st Generation ELISA Market Size, By Country/Region, 2012–2019 ($Million)
Table 31 Asia: 1st Generation ELISA Market Size, By Country/Region, 2012–2019 ($Million)
Table 32 2nd Generation ELISA Market Size, By Region, 2012–2019 ($Million)
Table 33 North America: 2nd Generation ELISA Market Size, By Region, 2012–2019 ($Million)
Table 34 Europe: 2nd Generation ELISA Market Size, By Country/Region, 2012–2019 ($Million)
Table 35 Asia: 2nd Generation ELISA Market Size, By Country/Region, 2012–2019 ($Million)
Table 36 3rd Generation ELISA Market Size, By Region, 2012–2019 ($Million)
Table 37 North America: 3rd Generation ELISA Market Size, By Country, 2012–2019 ($Million)
Table 38 Europe: 3rd Generation ELISA Market Size, By Country/Region, 2012–2019 ($Million)
Table 39 Asia: 3rd Generation ELISA Market Size, By Country/Region, 2012–2019 ($Million)
Table 40 4th Generation ELISA Market Size, By Region, 2012–2019 ($Million)
Table 41 North America: 4th Generation ELISA Market Size, By Country, 2012–2019 ($Million)
Table 42 Europe: 4th Generation ELISA Market Size, By Country/Region, 2012–2019 ($Million)
Table 43 Asia: 4th Generation ELISA Market Size, By Country/Region, 2012–2019 ($Million)
Table 44 EIAS and CLIAS Market Size, By Region, 2012–2019 ($Million)
Table 45 North America: EIAS and CLIAS Market Size, By Region, 2012–2019 ($Million)
Table 46 Europe: EIAS and CLIAS Market Size, By Country/Region, 2012–2019 ($Million)
Table 47 Asia: EIAS and CLIAS Market Size, By Country/Region, 2012–2019 ($Million)
Table 48 NGS Market Size, By Region, 2012–2019 ($Million)
Table 49 North America: NGS Market Size, By Region, 2012–2019 ($Million)
Table 50 Europe: NGS Market Size, By Country/Region, 2012–2019 ($Million)
Table 51 Asia: NGS Market Size, By Country/Region, 2012–2019 ($Million)
Table 52 Western Blot Assay Market Size, By Region, 2012–2019 ($Million)
Table 53 North America: Western Blot Assay Market Size, By Country, 2012–2019 ($Million)
Table 54 Europe: Western Blot Assay Market Size, By Country/Region, 2012–2019 ($Million)
Table 55 Asia: Western Blot Assay Market Size, By Country/Region, 2012–2019 ($Million)
Table 56 Blood Screening Market Size, By Products and Services, 2012–2019 ($Million)
Table 57 Blood Screening Instruments Market Size, By Region, 2012–2019 ($Million)
Table 58 North America: Blood Screening Instruments Market Size, By Country, 2012–2019 ($Million)
Table 59 Europe: Instruments Market Size, By Country, 2012–2019 ($Million)
Table 60 Asia: Instruments Market Size, By Country, 2012–2019 ($Million)
Table 61 Instruments Market Size, By Mode of Purchase, 2012–2019 ($Million)
Table 62 Reagents Market Size, By Region, 2012–2019 ($Million)
Table 63 North America: Blood Screening Reagents Market Size, By Country, 2012–2019 ($Million)
Table 64 Europe: Blood Screening Reagents Market Size, By Country, 2012–2019 ($Million)
Table 65 Asia: Reagents Market Size, By Country, 2012–2019 ($Million)
Table 66 Reagents Market Size, By Type, 2012–2019 ($Million)
Table 67 Blood Screening ELISA Reagents Market Size, By Region, 2012–2019 ($Million)
Table 68 North America: ELISA Reagents Market Size, By Country, 2012–2019 ($Million)
Table 69 Europe: ELISA Reagents Market Size, By Country, 2012–2019 ($Million)
Table 70 Asia: ELISA Reagents Market Size, By Country, 2012–2019 ($Million)
Table 71 ELISA Reagents Market Size, By Type, 2012–2019 ($Million)
Table 72 Blood Screening NAT Reagents Market Size, By Region, 2012–2019 ($Million)
Table 73 North America: NAT Reagents Market Size, By Country, 2012–2019 ($Million)
Table 74 Europe: NAT Reagents Market Size, By Country, 2012–2019 ($Million)
Table 75 Asia: NAT Reagents Market Size, By Country, 2012–2019 ($Million)
Table 76 NAT Reagents Market Size, By Type, 2012–2019 ($Million)
Table 77 Blood Screening Other Reagents Market Size, By Region, 2012–2019 ($Million)
Table 78 North America: Other Reagents Market Size, By Country, 2012–2019 ($Million)
Table 79 Europe: Other Reagents Market Size, By Country, 2012–2019 ($Million)
Table 80 Asia: Other Reagents Market Size, By Country, 2012–2019 ($Million)
Table 81 Software and Services Market Size, By Region, 2012–2019 ($Million)
Table 82 North America: Blood Screening Software and Services Market Size, By Country, 2012–2019 ($Million)
Table 83 Europe: Software and Services Market Size, By Region, 2012–2019 ($Million)
Table 84 Asia: Software and Services Market Size, By Country, 2012–2019 ($Million)
Table 85 Blood Screening Market Size, By End User, 2012–2019 ($Million)
Table 86 Market Size for Blood Banks, By Region, 2012–2019 ($Million)
Table 87 North America: Market Size for Blood Banks, By Country, 2012–2019 ($Million)
Table 88 Europe: Market Size for Blood Banks, By Country, 2012–2019 ($Million)
Table 89 Asia: Market Size for Blood Banks, By Country, 2012–2019 ($Million)
Table 90 Blood Screening Market Size for Hospitals, By Region, 2012–2019 ($Million)
Table 91 North America: Blood Screening Market Size for Hospitals, By Country, 2012–2019 ($Million)
Table 92 Europe: Market Size for Hospitals, By Country, 2012–2019 ($Million)
Table 93 Asia: Market Size for Hospitals, By Country, 2012–2019 ($Million)
Table 94 Global Blood Screening Market Size, By Region, 2012–2019 ($Million)
Table 95 North America: Blood Screening Market Size, By Country, 2012–2019 ($Million)
Table 96 Europe: Market Size, By Country, 2012–2019 ($Million)
Table 97 Asia: Market Size, By Country, 2012–2019 ($Million)
Table 98 North America: Market Size, By Technology, 2012–2019 ($Million)
Table 99 North America: Market Size for NAT, By Type, 2012–2019 ($Million)
Table 100 North America: Market Size for ELISA, By Type, 2012–2019 ($Million)
Table 101 North America: Market Size, By Products and Services, 2012–2019 ($Million)
Table 102 North America: Market Size for Reagents, By Type, 2012–2019 ($Million)
Table 103 North America: Market Size, By End User, 2012–2019 ($Million)
Table 104 U.S.: Blood Screening Market Size, By Technology, 2012–2019 ($Million)
Table 105 U.S.: Market Size for NAT, By Type, 2012–2019 ($Million)
Table 106 U.S.: Market Size for ELISA, By Type, 2012–2019 ($Million)
Table 107 U.S.: Market Size, By Products & Services, 2012–2019 ($Million)
Table 108 U.S.: Market Size for Reagents, By Type, 2012–2019 ($Million)
Table 109 U.S.: Market Size, By End User, 2012–2019 ($Million)
Table 110 Canada: Blood Screening Market Size, By Technology, 2012–2019 ($Million)
Table 111 Canada: Market Size for NAT, By Type, 2012–2019 ($Million)
Table 112 Canada: Market Size for ELISA, By Type, 2012–2019 ($Million)
Table 113 Canada: Market Size, By Products & Services, 2012–2019 ($Million)
Table 114 Canada: Market Size for Reagents, By Type, 2012–2019 ($Million)
Table 115 Canada: Market Size, By End User, 2012–2019 ($Million)
Table 116 Europe: Market Size, By Technology, 2012–2019 ($Million)
Table 117 Europe: Market Size for NAT, By Type, 2012–2019 ($Million)
Table 118 Europe: Market Size for ELISA, By Type, 2012–2019 ($Million)
Table 119 Europe: Market Size, By Products and Services, 2012–2019 ($Million)
Table 120 Europe: Market Size for Reagents, By Type, 2012–2019 ($Million)
Table 121 Europe: Market Size, By End User, 2012–2019 ($Million)
Table 122 Germany: Blood Screening Market Size, By Technology, 2012–2019 ($Million)
Table 123 Germany: Market Size for NAT, By Type, 2012–2019 ($Million)
Table 124 Germany: Market Size for ELISA, By Type, 2012–2019 ($Million)
Table 125 Germany: Market Size, By Products & Services, 2012–2019 ($Million)
Table 126 Germany: Market Size for Reagents, By Type, 2012–2019 ($Million)
Table 127 Germany: Market Size, By End User, 2012–2019 ($Million)
Table 128 France: Blood Screening Market Size, By Technology, 2012–2019 ($Million)
Table 129 France: Market Size for NAT, By Type, 2012–2019 ($Million)
Table 130 France: Market Size for ELISA, By Type, 2012–2019 ($Million)
Table 131 France: Market Size, By Products & Services, 2012–2019 ($Million)
Table 132 France: Market Size for Reagents, By Type, 2012–2019 ($Million)
Table 133 France: Market Size, By End User, 2012–2019 ($Million)
Table 134 U.K.: Blood Screening Market Size, By Technology, 2012–2019 ($Million)
Table 135 U.K.: Market Size for NAT, By Type, 2012–2019 ($Million)
Table 136 U.K.: Market Size for ELISA, By Type, 2012–2019 ($Million)
Table 137 U.K.: Market Size, By Products & Services, 2012–2019 ($Million)
Table 138 U.K.: Market Size for Reagents, By Type, 2012–2019 ($Million)
Table 139 U.K.: Market Size, By End User, 2012–2019 ($Million)
Table 140 Italy: Blood Screening Market Size, By Technology, 2012–2019 ($Million)
Table 141 Italy: Market Size for NAT, By Type, 2012–2019 ($Million)
Table 142 Italy: Market Size for ELISA, By Type, 2012–2019 ($Million)
Table 143 Italy: Market Size, By Products & Services, 2012–2019 ($Million)
Table 144 Italy: Market Size for Reagents, By Type, 2012–2019 ($Million)
Table 145 Italy: Market Size, By End User, 2012–2019 ($Million)
Table 146 Spain: Blood Screening Market Size, By Technology, 2012–2019 ($Million)
Table 147 Spain: Market Size for NAT, By Type, 2012–2019 ($Million)
Table 148 Spain: Market Size for ELISA, By Type, 2012–2019 ($Million)
Table 149 Spain: Market Size, By Products & Services, 2012–2019 ($Million)
Table 150 Spain: Blood Screening Market Size for Reagents, By Type, 2012–2019 ($Million)
Table 151 Spain: Blood Screening Market Size, By End User, 2012–2019 ($Million)
Table 152 ROE: Blood Screening Market Size, By Technology, 2012–2019 ($Million)
Table 153 ROE: Market Size for NAT, By Type, 2012–2019 ($Million)
Table 154 ROE: Market Size for ELISA, By Type, 2012–2019 ($Million)
Table 155 ROE: Market Size, By Products & Services, 2012–2019 ($Million)
Table 156 ROE: Blood Screening Market Size for Reagents, By Type, 2012–2019 ($Million)
Table 157 ROE: Blood Screening Market Size, By End User, 2012–2019 ($Million)
Table 158 Asia: Blood Screening Market Size, By Technology, 2012–2019 ($Million)
Table 159 Asia: Market Size for NAT, By Type, 2012–2019 ($Million)
Table 160 Asia: Blood Screening Market Size for ELISA, By Type, 2012–2019 ($Million)
Table 161 Asia: Market Size, By Products & Services, 2012–2019 ($Million)
Table 162 Asia: Blood Screening Market Size for Reagents, By Type, 2012–2019 ($Million)
Table 163 Asia: Market Size, By End User, 2012–2019 ($Million)
Table 164 Japan: Blood Screening Market Size, By Technology, 2012–2019 ($Million)
Table 165 Japan: Market Size for NAT, By Type, 2012–2019 ($Million)
Table 166 Japan: Blood Screening Market Size for ELISA, By Type, 2012–2019 ($Million)
Table 167 Japan: Market Size, By Products & Services, 2012–2019 ($Million)
Table 168 Japan: Blood Screening Market Size for Reagents, By Type, 2012–2019 ($Million)
Table 169 Japan: Market Size, By End User, 2012–2019 ($Million)
Table 170 China: Blood Screening Market Size, By Technology, 2012–2019 ($Million)
Table 171 China: Market Size for NAT, By Type, 2012–2019 ($Million)
Table 172 China: Blood Screening Market Size for ELISA, By Type, 2012–2019 ($Million)
Table 173 China: Market Size, By Products & Services, 2012–2019 ($Million)
Table 174 China: Blood Screening Market Size for Reagents, By Type, 2012–2019 ($Million)
Table 175 China: Market Size, By End User, 2012–2019 ($Million)
Table 176 India: Blood Screening Market Size, By Technology, 2012–2019 ($Million)
Table 177 India: Market Size for NAT, By Type, 2012–2019 ($Million)
Table 178 India: Blood Screening Market Size for ELISA, By Type, 2012–2019 ($Million)
Table 179 India: Market Size, By Products & Services, 2012–2019 ($Million)
Table 180 India: Blood Screening Market Size for Reagents, By Type, 2012–2019 ($Million)
Table 181 India: Market Size, By End User, 2012–2019 ($Million)
Table 182 ROA: Blood Screening Market Size, By Technology, 2012–2019 ($Million)
Table 183 ROA: Market Size for NAT, By Type, 2012–2019 ($Million)
Table 184 ROA: Market Size for ELISA, By Type, 2012–2019 ($Million)
Table 185 ROA: Market Size, By Products & Services, 2012–2019 ($Million)
Table 186 ROA: Market Size for Reagents, By Type, 2012–2019 ($Million)
Table 187 ROA: Market Size, By End User, 2012–2019 ($Million)
Table 188 ROW: Blood Screening Market Size, By Technology, 2012–2019 ($Million)
Table 189 ROW: Market Size for NAT, By Type, 2012–2019 ($Million)
Table 190 ROW: Blood Screening Market Size for ELISA, By Type, 2012–2019 ($Million)
Table 191 ROW: Market Size, By Products & Services, 2012–2019 ($Million)
Table 192 ROW: Market Size for Reagents, By Type, 2012–2019 ($Million)
Table 193 ROW: Market Size, By End User, 2012–2019 ($Million)
Table 194 New Product Launches
Table 195 Mergers and Acquisitions
Table 196 Regulatory Approvals
Table 197 Partnerships and Agreements
List of Figures (34 Figures)
Figure 1 Research Methodology
Figure 2 Top-Down Approach
Figure 3 Bottom-Up Approach
Figure 4 Breakdown of Primary Interviews: By Company Type, Designation, and Region
Figure 1 Blood Screening Market Snapshot, By Technology (2014 vs. 2019)
Figure 2 Reagents Segment Dominates Blood Screening Market With the CAGR of 10.9% During Forecasted Period
Figure 3 4th Generation ELISA is Largest Segment in 2014 Blood Screening ELISA Market and Would Continue Its Growth Story Till 2019
Figure 4 Blood Banks Segment is Largest Contributor and Fastest Growing Segment in Blood Screening Market During Forecasted Period
Figure 5 Global Blood Screening Market, By Region: North America Holds Largest Share and Asia is Fastest Growing Region in 2014
Figure 6 NAT Segment to Offer Attractive Growth Opportunities
Figure 7 Blood Screening Reagents Segment to Grow at Highest Rate
Figure 8 NAT Reagents Contributes Highest Share in Blood Screening Reagents Market
Figure 9 4th Generation ELISA Segment Expected to Grow at Highest CAGR in Asia During Forecasted Period
Figure 10 Blood Banks Dominates in Blood Screening Market and Witness Highest CAGR During Forecasted Period
Figure 11 China to Witness Highest Growth in Forecast Period
Figure 12 Technological Innovation and Differentiated Products Are Increasing Competition Among Market Players
Figure 13 NAT Testing Will Continue to Dominate the Market During the Forecast Period
Figure 14 Real-Time PCR Expected to Grow at A Double-Digit CAGR From 2014 to 2019
Figure 15 Asian 4th Generation ELISA Market Expected to Double By 2019
Figure 16 Reagents Segment Will Continue to Dominate the Blood Screening Market During Forecast Period
Figure 17 Asia is the Fastest-Growing Region in the Blood Screening Reagent Market
Figure 18 China to Witness the Highest Growth in the Blood Screening NAT Reagents Market in Asia
Figure 19 Blood Screening Market Segmentation, By End User
Figure 20 Blood Banks Segment Will Continue to Dominate the Blood Screening Market During the Forecast Period
Figure 21 Geographic Snapshot (2014): Emerging Markets Offer Significant Growth Opportunities in the Blood Screening Market
Figure 22 North America: Market Growth Will Be Driven By Innovative Blood Screening Instruments and Reagents
Figure 23 China Offers Immense Growth Opportunities for the Blood Screening Market
Figure 24 Battle for Market Share: New Product Launches Was the Key Strategy
Figure 25 Product Benchmarking for Top 5 Players
Figure 26 Grifols: Company Snapshot
Figure 27 Roche Diagnostics: Company Snapshot
Figure 28 Abbott Laboratories: Company Snapshot
Figure 29 Biomérieux: Company Snapshot
Figure 30 Bio-Rad Laboratories, Inc.: Company Snapshot
Figure 31 Siemens AG : Company Snapshot
Figure 32 Thermo Fisher Scientific, Inc.: Company Snapshot
Figure 33 Danaher Corporation: Company Snapshot
Figure 34 Becton, Dickinson and Company: Company Snapshot
プレスリリース
プレスリリース
 当レポートのプレスリリースは発行されておりません。
 リサーチカテゴリ一覧
 スマートグリッド


 お問合わせはこちらから