
 HOME
HOME 市場調査レポート
機械化灌漑システムの世界市場:2019年市場予測とグローバルトレンド
Mechanized Irrigation Systems Market by Type (Center Pivot, Lateral Move, Solid Set, & Others), Application (Agricultural Crops, Nursery Crops, and Lawns & Gardens), & by Region - Global Trends & Forecast to 2019
- 出版元:MarketsandMarkets(米国)
- 発行年:2015年3月
- 定価 Single User License(1名様ライセンス)US$5,650(米国ドル)/Multi User License(5名様)$6,650 /Corporate User License $8,150
- ご請求は円換算(お見積り日TTSレート)となります。
- 納品形態:PDF by Email
- 当調査レポートは英文177ページになります。
- 商品コード:MAM058
お問い合わせ、お見積りのリクエストは下のボタンをクリックしてご入力ください。


【レポート紹介】
機械化灌漑システム(mechanized irrigation systems)の世界市場は2014年以後、年平均15.3%成長を続け、2019年には48億4000万ドルの市場規模に達すると予測されます。高い費用対効果、技術的進化、世界的な人口増加および食料需要増加は、同市場の主要な促進要因となっています。気候変動、水不足への懸念や、作物収穫の最適化への取り組みなどを背景に、同世界市場は直近5年間でかつてない成長率で拡大を遂げています。地域的には、特に北米とアジア太平洋での高成長が見られます。同市場は、小規模企業も含め多数参入型の高競合市場となっているものの、Valmont Industries (U.S.) とLindsay Corporation (U.S.)の大手2社で市場シェアの50%近くを占めると推計されます。
レポートでは、機械化灌漑システムの世界市場を詳細に調査分析、各種セグメントでの2019年に至る市場規模予測、動向分析、主要企業情報などを概略以下の構成でお届けいたします。
<セグメント別市場予測-2019年>
●タイプ別市場予測-2019
・センターピボット
・ソリッドセット
・その他 (travelling gun, permanent set, side roll, and mobile irrigation systems)
●用途別市場予測-2019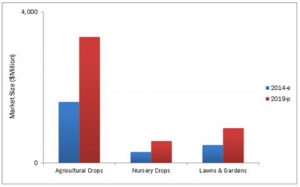
・農作物Agricultural crops
・育苗 Nursery crops
・芝生、庭園 Lawns and Gardens
●国、地域別市場予測
・北米地域
- 米国
- カナダ
- メキシコ
・欧州地域
- ドイツ
- フランス
- イタリア
- ロシア
- ウクライナ
- 英国
- その他欧州
・アジア太平洋地域
- 中国
- インド
- オーストラリア
- 日本
- その他アジア太平洋
・その他地域
- ブラジル
- 南アフリカ
- サウジアラビア
- 韓国
- エジプト
- イスラエル
- その他RoW
<主要企業動向>
・Jain Irrigation Systems Limited
・Lindsay Corporation
・Nelson Irrigation Corporation
・Rivulis Irrigation
・Netafim Limited
・Rain Bird Corporation
・The Toro Company
・T-L Irrigation
・Valmont Industries
・EPC Industries Limited
【レポート詳細目次、データ項目一覧(List of Tables)は当ページ下を参照ください】
英文詳細目次(table of contents)
【原文詳細目次】
Mechanized Irrigation Systems Market by Type (Center Pivot, Lateral Move, Solid Set, & Others), Application (Agricultural Crops, Nursery Crops, and Lawns & Gardens), & by Region - Global Trends & Forecast to 2019
Table of Contents
1 Introduction (Page No. - 15)
1.1 Objectives of the Study
1.2 Market Definition
1.3 Market Scope
1.4 Years Considered for the Study
1.5 Currency
1.6 Stakeholders
1.7 Limitations
2 Research Methodology (Page No. - 18)
2.1 Research Data
2.1.1 Secondary Data
2.1.1.1 Key Data From Secondary Sources
2.1.2 Primary Data
2.1.2.1 Key Data From Primary Sources
2.1.2.2 Key Industry Insights
2.1.2.3 Breakdown of Primary Interviews
2.2 Factor Analysis
2.2.1 Introduction
2.2.2 Demand Side Analysis
2.2.2.1 Growing Population and Declining Working Population in Farms
2.2.2.2 Water Scarcity Demands Improved Efficiency in Irrigation Systems
2.2.2.3 Shrinking Arable Land
2.2.3 Supply Side Analysis
2.2.3.1 Parent Market Analysis: Government Initiatives to Promote Irrigation Equipment Industry
2.3 Global Market Size Estimation
2.3.1 Bottom-Up Approach
2.3.2 Top-Down Approach
2.4 Market Breakdown & Data Triangulation
2.5 Research Assumptions & Limitations
2.5.1 Assumptions
2.5.2 Limitations
3 Executive Summary (Page No. - 31)
4 Premium Insights (Page No. - 35)
4.1 Attractive Opportunities in Mechanized Irrigation Systems Market
4.2 Mechanized Irrigation Systems Market: By Type
4.3 Asia-Pacifc Mechanized Irrigation Systems Market
4.4 Mechanized Irrigation Systems Market: By Type
4.5 U.S. Accounted for Largest Market Share in Global Market, 2013
4.6 Life Cycle Analysis, By Region
5 Market Overview (Page No. - 41)
5.1 Introduction
5.2 Evolution
5.3 Market Segmentation
5.3.1 Mechanized Irrigation Systems Market, By Type
5.3.2 Mechanized Irrigation Systems Market, By Application
5.4 Market Dynamics
5.4.1 Drivers
5.4.1.1 Use of Technology in Mechanized Irrigation Systems
5.4.1.2 Protection Against Drought With Mechanized Irrigation
5.4.1.3 Low-Cost Irrigation Technique
5.4.1.4 Rising Population & Increasing Food Requirements
5.4.1.5 Improvement in Crop Yield & Quality
5.4.1.6 Rapid Growth in Greenhouse Vegetable Production
5.4.2 Restraints
5.4.2.1 High Initial Investment
5.4.2.2 Continuous Maintenance Requirement
5.4.3 Opportunities
5.4.3.1 Move From Gravity Irrigation to Center Pivot Systems
5.4.3.2 Strong Progress in New and Emerging Markets (Asia-Pacific & ROW)
5.4.4 Challenges
5.4.4.1 Environmental Degradation and Climate Change
5.4.5 Burning Issue
5.4.5.1 Absence of Proper Monitoring Agency Leads to Product Duplication
6 Industry Trends (Page No. - 52)
6.1 Introduction
6.1.1 Advantages of Center Pivot Irrigation Systems
6.2 Value Chain Analysis
6.3 Supply Chain Analysis
6.3.1 Prominent Companies
6.3.2 Small & Medium Enterprises
6.3.3 End-Users
6.4 Industry Insights
6.4.1 Central Pivot Segment Dominates the Mechanized Irrigation Systems Market
6.4.2 Agricultural Crops is the Fastest Growing Application Segment in the Mechanized Irrigation Systems Market
6.5 Porter’s Five Forces Analysis
6.5.1 Intensity of Competitive Rivalry
6.5.2 Bargaining Power of Suppliers
6.5.3 Bargaining Power of Buyers
6.5.4 Threat of New Entrants
6.5.5 Threat of Substitutes
6.6 Strategic Benchmarking
6.6.1 Strategic Partnerships & Advanced Technology
7 Mechanized Irrigation Systems Market, By Type (Page No. - 61)
7.1 Introduction
7.2 Center Pivot
7.2.1 Components of Center Pivot Irrigation Systems
7.3 Lateral Move
7.3.1 Components of Lateral Move Irrigation Systems
7.4 Solid Set
7.4.1 Advantages
7.4.2 Disadvantages
7.5 Others
8 Mechanized Irrigation Systems Market, By Application (Page No. - 72)
8.1 Introduction
8.2 Agricultural Crops
8.3 Nursery Crops
8.4 Lawns & Gardens
9 Mechanized Irrigation Systems Market, By Region (Page No. - 78)
9.1 Introduction
9.2 North America
9.2.1 U.S.
9.2.2 Canada
9.2.3 Mexico
9.3 Europe
9.3.1 Germany
9.3.2 France
9.3.3 Italy
9.3.4 Russia
9.3.5 Ukraine
9.3.6 U.K.
9.3.7 Rest of Europe
9.4 Asia-Pacific
9.4.1 China
9.4.2 India
9.4.3 Australia
9.4.4 Japan
9.4.5 Rest of Asia-Pacific
9.5 Rest of the World (ROW)
9.5.1 Brazil
9.5.2 South Africa
9.5.3 Saudi Arabia
9.5.4 Republic of Korea
9.5.5 Egypt
9.5.6 Israel
9.5.7 Others in ROW
10 Competitive Landscape (Page No. - 127)
10.1 Overview
10.2 Mechanized Irrigation Systems Market: Market Share Analysis
10.3 Competitive Situation & Trends
10.3.1 New Product Launches & Developments
10.3.2 Agreements, Partnerships, Joint Ventures, & Collaborations
10.3.3 Mergers & Acquisitions
10.3.4 Expansions & Investments
11 Company Profiles (Page No. - 137)
11.1 Introduction
11.2 Jain Irrigation Systems Limited
11.2.1 Business Overview
11.2.2 Products
11.2.3 Key Strategies
11.2.4 Developments
11.2.5 SWOT Analysis
11.2.6 MNM View
11.3 Lindsay Corporation
11.3.1 Business Overview
11.3.2 Products
11.3.3 Key Strategies
11.3.4 Developments
11.3.5 SWOT Analysis
11.3.6 MNM View
11.4 Nelson Irrigation Corporation
11.4.1 Business Overview
11.4.2 Products
11.4.3 Key Strategy
11.4.4 Developments
11.5 Rivulis Irrigation
11.5.1 Business Overview
11.5.2 Products
11.5.3 Key Strategies
11.5.4 Developments
11.5.5 SWOT Analysis
11.5.6 MNM View
11.6 Netafim Limited
11.6.1 Business Overview
11.6.2 Products
11.6.3 Key Strategies
11.6.4 Developments
11.7 Rain Bird Corporation
11.7.1 Business Overview
11.7.2 Products
11.7.3 Key Strategies
11.7.4 Developments
11.8 The Toro Company
11.8.1 Business Overview
11.8.2 Products
11.8.3 Key Strategy
11.8.4 Developments
11.8.5 SWOT Analysis
11.8.6 MNM View
11.9 T-L Irrigation
11.9.1 Business Overview
11.9.2 T-L Irrigation: Business Overview
11.9.3 Products
11.9.4 Key Strategy
11.9.5 Developments
11.1 Valmont Industries
11.10.1 Business Overview
11.10.2 Products
11.10.3 Key Strategy
11.10.4 Developments
11.10.5 SWOT Analysis
11.10.6 MNM View
11.11 EPC Industries Limited
11.11.1 Business Overview
11.11.2 Products
11.11.3 Key Strategy
11.11.4 Developments
12 Appendix (Page No. - 181)
12.1 Insights of Industry Experts
12.2 Discussion Guide
12.3 Company Developments
12.3.1 New Product Launches/Developments
12.3.2 Agreements, Partnerships, Joint Ventures, & Collaborations
12.3.3 Mergers & Acquisitions
12.3.4 Expansions & Investments
12.4 Introducing RT: Real Time Market Intelligence
12.5 Available Customizations
12.6 Related Reports
List of Tables (76 Tables)
Table 1 Global Water Availability, 2012 (Million Cubic Km)
Table 2 Assumptions of the Study
Table 3 Impact of Key Drivers on the Mechanized Irrigation Systems Market
Table 4 Restraints to the Growth of Mechanized Irrigation Systems Market
Table 5 Challenges to the Mechanized Irrigation Systems Market
Table 6 Mechanized Irrigation Systems Market Size, By Type, 2012-2019 ($Million)
Table 7 Center Pivot: Mechanized Irrigation Systems, By Region, 2012-2019 ($Million)
Table 8 Lateral Move: Mechanized Irrigation Systems, By Region, 2012-2019 ($Million)
Table 9 Solid Set: Mechanized Irrigation Systems, By Region, 2012-2019 ($Million)
Table 10 Other Mechanized Irrigation Systems, By Region, 2012-2019 ($Million)
Table 11 Comparison of Different Types of Irrigation Systems
Table 12 Mechanized Irrigation Systems Market, By Application, 2012-2019 ($Million)
Table 13 Agricultural Crops: Mechanized Irrigation Systems Market Size, By Region, 2012-2019 ($Million)
Table 14 Nursery Crops: Mechanized Irrigation Systems Market Size, By Region, 2012-2019 ($Million)
Table 15 Lawns & Gardens: Mechanized Irrigation Systems Market Size, By Region, 2012-2019 ($Million)
Table 16 Mechanized Irrigation Systems Market Size, By Region, 2012-2019 ($Million)
Table 17 North America: Mechanized Irrigation Systems Market Size, By Country, 2012–2019 ($Million)
Table 18 North America: Mechanized Irrigation Systems Market Size, By Type, 2012-2019 ($Million)
Table 19 North America: Mechanized Irrigation Systems Market Size, By Application, 2012-2019 ($Million)
Table 20 U.S.: Mechanized Irrigation Systems Size, By Type, 2012-2019 ($Million)
Table 21 U.S.: Mechanized Irrigation Systems Size, By Application, 2012-2019 ($Million)
Table 22 Canada: Mechanized Irrigation Systems Market Size, By Type, 2012-2019 ($Million)
Table 23 Canada: Mechanized Irrigation Systems Market Size, By Application, 2012-2019 ($Million)
Table 24 Mexico: Mechanized Irrigation Systems Market Size, By Type, 2012-2019 ($Million)
Table 25 Mexico: Mechanized Irrigation Systems Market Size, By Application, 2012-2019 ($Million)
Table 26 Europe: Mechanized Irrigation Systems Market Size, By Country, 2012–2019 ($Million)
Table 27 Europe: Mechanized Irrigation Systems Market Size, By Type, 2012-2019 ($Million)
Table 28 Europe: Mechanized Irrigation Systems Market Size, By Application, 2012-2019 ($Million)
Table 29 Germany: Mechanized Irrigation Systems Market Size, By Type, 2012-2019 ($Million)
Table 30 Germany: Mechanized Irrigation Systems Market Size, By Application, 2012-2019 ($Million)
Table 31 France: Mechanized Irrigation Systems Market Size, By Type, 2012-2019 ($Million)
Table 32 France: Mechanized Irrigation Systems Market Size, By Application, 2012-2019 ($Million)
Table 33 Italy: Mechanized Irrigation Systems Market Size, By Type, 2012-2019 ($Million)
Table 34 Italy: Mechanized Irrigation Systems Market Size, By Application, 2012-2019 ($Million)
Table 35 Russia: Mechanized Irrigation Systems Market Size, By Type, 2012-2019 ($Million)
Table 36 Russia: Mechanized Irrigation Systems Market Size, By Application, 2012-2019 ($Million)
Table 37 Ukraine: Mechanized Irrigation Systems Market Size, By Type, 2012-2019 ($Million)
Table 38 Ukraine: Mechanized Irrigation Systems Market Size, By Application, 2012-2019 ($Million)
Table 39 U.K.: Mechanized Irrigation Systems Market Size, By Type, 2012-2019 ($Million)
Table 40 U.K.: Mechanized Irrigation Systems Market Size, By Application, 2012-2019 ($Million)
Table 41 Rest of Europe: Mechanized Irrigation Systems Market Size, By Type, 2012-2019 ($Million)
Table 42 Rest of Europe: Mechanized Irrigation Systems Market Size, By Application, 2012-2019 ($Million)
Table 43 Asia-Pacific: Mechanized Irrigation Systems Market Size, By Country, 2012–2019 ($Million)
Table 44 Asia-Pacific: Mechanized Irrigation Systems Market Size, By Type, 2012-2019 ($Million)
Table 45 Asia-Pacific: Mechanized Irrigation Systems Market Size, By Application, 2012-2019 ($Million)
Table 46 China: Mechanized Irrigation Systems Market Size, By Type, 2012-2019 ($Million)
Table 47 China: Mechanized Irrigation Systems Market Size, By Application, 2012-2019 ($Million)
Table 48 India: Mechanized Irrigation Systems Market Size, By Type, 2012-2019 ($Million)
Table 49 India: Mechanized Irrigation Systems Market Size, By Application, 2012-2019 ($Million)
Table 50 Australia: Mechanized Irrigation Systems Market Size, By Type, 2012-2019 ($Million)
Table 51 Australia: Mechanized Irrigation Systems Market Size, By Application, 2012-2019 ($Million)
Table 52 Japan: Mechanized Irrigation Systems Market Size, By Type, 2012-2019 ($Million)
Table 53 Japan: Mechanized Irrigation Systems Market Size, By Application, 2012-2019 ($Million)
Table 54 Rest of Asia-Pacific: Mechanized Irrigation Systems Market Size, By Type, 2012-2019 ($Million)
Table 55 Rest of Asia-Pacific: Mechanized Irrigation Systems Market Size, By Application, 2012-2019 ($Million)
Table 56 ROW: Mechanized Irrigation Systems Market Size, By Country, 2012–2019 ($Million)
Table 57 ROW: Mechanized Irrigation Systems Market Size, By Type, 2012-2019 ($Million)
Table 58 ROW: Mechanized Irrigation Systems Market Size, By Application, 2012-2019 ($Million)
Table 59 Brazil: Mechanized Irrigation Systems Market Size, By Type, 2012-2019 ($Million)
Table 60 Brazil: Mechanized Irrigation Systems Market Size, By Application, 2012-2019 ($Million)
Table 61 South Africa: Mechanized Irrigation Systems Market Size, By Type, 2012-2019 ($Million)
Table 62 South Africa: Mechanized Irrigation Systems Market Size, By Application, 2012-2019 ($Million)
Table 63 Saudi Arabia: Mechanized Irrigation Systems Market Size, By Type, 2012-2019 ($Million)
Table 64 Saudi Arabia: Mechanized Irrigation Systems Market Size, By Application, 2012-2019 ($Million)
Table 65 Republic of Korea: Mechanized Irrigation Systems Market Size, By Type, 2012-2019 ($Million)
Table 66 Republic of Korea: Mechanized Irrigation Systems Market Size, By Application, 2012-2019 ($Million)
Table 67 Egypt: Mechanized Irrigation Systems Market Size, By Type, 2012-2019 ($Million)
Table 68 Egypt: Mechanized Irrigation Systems Market Size, By Application, 2012-2019 ($Million)
Table 69 Israel: Mechanized Irrigation Systems Market Size, By Type, 2012-2019 ($Million)
Table 70 Israel: Mechanized Irrigation Systems Market Size, By Application, 2012-2019 ($Million)
Table 71 Others in ROW: Mechanized Irrigation Systems Market Size, By Type, 2012-2019 ($Million)
Table 72 Others in ROW: Mechanized Irrigation Systems Market Size, By Application, 2012-2019 ($Million)
Table 73 New Product Launches & Developments, 2010–2014
Table 74 Agreements, Partnerships, Joint Ventures, & Collaborations, 2010–2014
Table 75 Mergers & Acquisitions, 2010–2014
Table 76 Expansions & Investments, 2010–2014
List of Figures (58 Figures)
Figure 1 Mechanized Irrigation Systems Market Segmentation
Figure 2 Research Design
Figure 3 Global Population Dynamics: Declining Rural Population, 1961-2050 (Billion)
Figure 4 Per Capita Arable Land, 1950-2020
Figure 5 Market Size Estimation Methodology: Bottom-Up Approach
Figure 6 Market Size Estimation Methodology: Top-Down Approach
Figure 7 Data Triangulation
Figure 8 Mechanized Irrigation Systems Market Snapshot (2014 vs. 2019)
Figure 9 Agricultural Crops Projected to Be the Fastest-Growing Application Segment By 2019
Figure 10 Mechanized Irrigation Systems Market Trend, By Region, 2014
Figure 11 High Growth Rate Observed in Asia-Pacific Countries
Figure 12 Attractive Opportunities in Mechanized Irrigation Systems Market
Figure 13 Center Pivot Segment to Grow at Highest Rate in the Next Five Years
Figure 14 Center Pivot Segment Accounted for Largest Share in the Asia-Pacific Mechanized Irrigation Systems Market, 2013
Figure 15 U.S. & China: Two Largest Markets for the Next Five Years
Figure 16 U.S. Dominated the Global Mechanized Irrigation Systems Market
Figure 17 Asia-Pacific Region to Provide Immense Potential Opportunities for Mechanized Irrigation Systems Market Growth
Figure 18 Development of Mechanized Irrigation Systems
Figure 19 Mechanized Irrigation Systems Market Segmentation, By Type
Figure 20 Mechanized Irrigation Systems Market, By Application
Figure 21 Increasing Need for Better Yield Driving the Growth of Mechanized Irrigation Systems Market
Figure 22 Production Process Contributes Major Value to Overall Price of Mechanized Irrigation System
Figure 23 Research Organizations & Technologists: Integral Part of Supply Chain of Mechanized Irrigation Systems Market
Figure 24 Central Pivot Segment Dominated the Mechanized Irrigation Systems Market, 2013
Figure 25 North America is the Largest Market for Agricultural Crops Segment
Figure 26 Porter’s Five Forces Analysis: Mechanized Irrigation Systems Market
Figure 27 Strategic Benchmarking: Key Players Prefer New Product Development to Expand Their Business in the Mechanized Irrigation Systems Market
Figure 28 Mechanized Irrigation Systems, By Type: A Snapshot
Figure 29 Center Pivot & Lateral Move Mechanized Irrigation Systems: Advantages & Disadvantages
Figure 30 Center Pivot: Market Growth (2012-2019)
Figure 31 Asia-Pacific to Dominate in the Solid Set Segment, 2014-2019
Figure 32 Mechanized Irrigation Systems Market, By Application: A Snapshot
Figure 33 Agricultural Crops: Fastest Growing Segment, 2014-2019
Figure 34 Agricultural Crops: Market Growth (2014-2019)
Figure 35 Geographic Snapshot (2014-2019): Rapidly Growing Markets Are Emerging as New Hotspots
Figure 36 North American Mechanized Irrigation Systems Market: A Snapshot
Figure 37 European Mechanized Irrigation Systems Market: A Snapshot
Figure 38 Russia: Largest Share in European Mechanized Irrigation Systems Market, 2013
Figure 39 China Was the Market Leader in the Asia-Pacific Region in 2013
Figure 40 New Product Launches & Developments Were Preferred By Key Mechanized Irrigation System Companies in the Last Five Years (2014-2019)
Figure 41 Mechanized Irrigation Systems Market Share, By Key Player, 2013
Figure 42 New Product Developments Fueled Growth & Innovation of Mechanized Irrigation Systems Market Between 2010 to 2014
Figure 43 Battle for Market Share, 2013: New Product Launches & Developments Was the Key Strategy
Figure 44 Geographic Revenue Mix of Top 5 Mechanized Irrigation System Manufacturers
Figure 45 Jain Irrigation Systems Limited: Business Overview
Figure 46 Jain Irrigation Systems Limited.: SWOT Analysis
Figure 47 Lindsay Corporation: Business Overview
Figure 48 Lindsay Corporation: SWOT Analysis
Figure 49 Nelson Irrigation Corporation: Business Overview
Figure 50 Rivulis Irrigation: Business Overview
Figure 51 Rivulis Irrigation: SWOT Analysis
Figure 52 Netafim Limited: Business Overview
Figure 53 Rain Bird Crporation: Business Overview
Figure 54 The Toro Company: Business Overview
Figure 55 The Toro Company: SWOT Analysis
Figure 56 Valmont Industries: Businss Overview
Figure 57 Valmont Industries: SWOT Analysis
Figure 58 EPC Industries Ltd.: Business Overview
プレスリリース
プレスリリース
 当レポートのプレスリリースは発行されておりません。
 リサーチカテゴリ一覧
 スマートグリッド


 お問合わせはこちらから